- Cmind AI by Weihong Zhang
- Posts
- 73% Predicted Beats — Breadth vs Conviction | Q4-to-Q1 sector shifts: where earnings leadership is broadening and fading
73% Predicted Beats — Breadth vs Conviction | Q4-to-Q1 sector shifts: where earnings leadership is broadening and fading
Health Care, Communication Services, and Consumer Discretionary gain altitude while Utilities and Energy lose momentum | Top Movers
Weihong Zhang
April 06, 2026
Cmind Weekly Earnings Signal - April 6 – April 11, 2026
This week is less about volume and more about framing the quarter correctly.
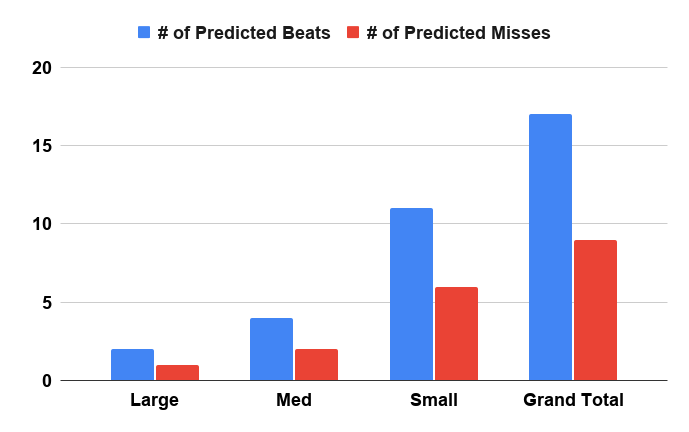
The attached setup brief makes the macro point well: early April is the pre-volume phase of Q1 earnings, where expectations, revisions, options pricing, and sector leadership matter more than the raw count of companies reporting. That framing fits the data. The full Q1 outlook across 3,823 names is broadly constructive, with 2,809 predicted beats and 1,014 predicted misses, or roughly a 73% / 27% beat-miss split. Large caps screen best at about 81% predicted beats, mid-caps are close behind at 80%, and small caps are still positive but looser at 68%.
But the current week’s board is much narrower and much less clean than the quarter-level heatmap. The weekly file contains just 26 companies, no true mega-cap anchor, and only seven names above 60% beat probability. Said differently: the quarter looks broadly green, but week one is still a selective tape, not a universal green light.
That gap between quarter-level breadth and week-one tradability is the key idea for this issue. Q1 is starting with a supportive aggregate backdrop, but the actionable opportunities remain concentrated: Industrials is the cleanest current-week cluster, Consumer Discretionary is strong at the top end thanks to LEVI, Technology remains bifurcated, and Consumer Staples has become one of the most fragile sectors on the short-term board despite still looking acceptable at the broader quarter level.
The other important layer is thematic. The attached event brief argues that hedge funds are increasingly focused on AI capex versus AI cash flow, AI ROI and RPO, earnings breadth versus leadership concentration, and the first cracks in AI sentiment. That matters because Q1 may still deliver broad EPS growth, but the market is no longer rewarding narrative alone. The bar is shifting from “announce spend” to “show monetization.”
Feature of the Week:
Q1 Earnings Outlook — broad beat breadth, but not broad conviction
The most important conclusion from the full-quarter outlook is that Q1 is starting from a positive aggregate base. Across the full universe, the heatmap is greener than not, and several sectors stand out as clear positive breadth stories.
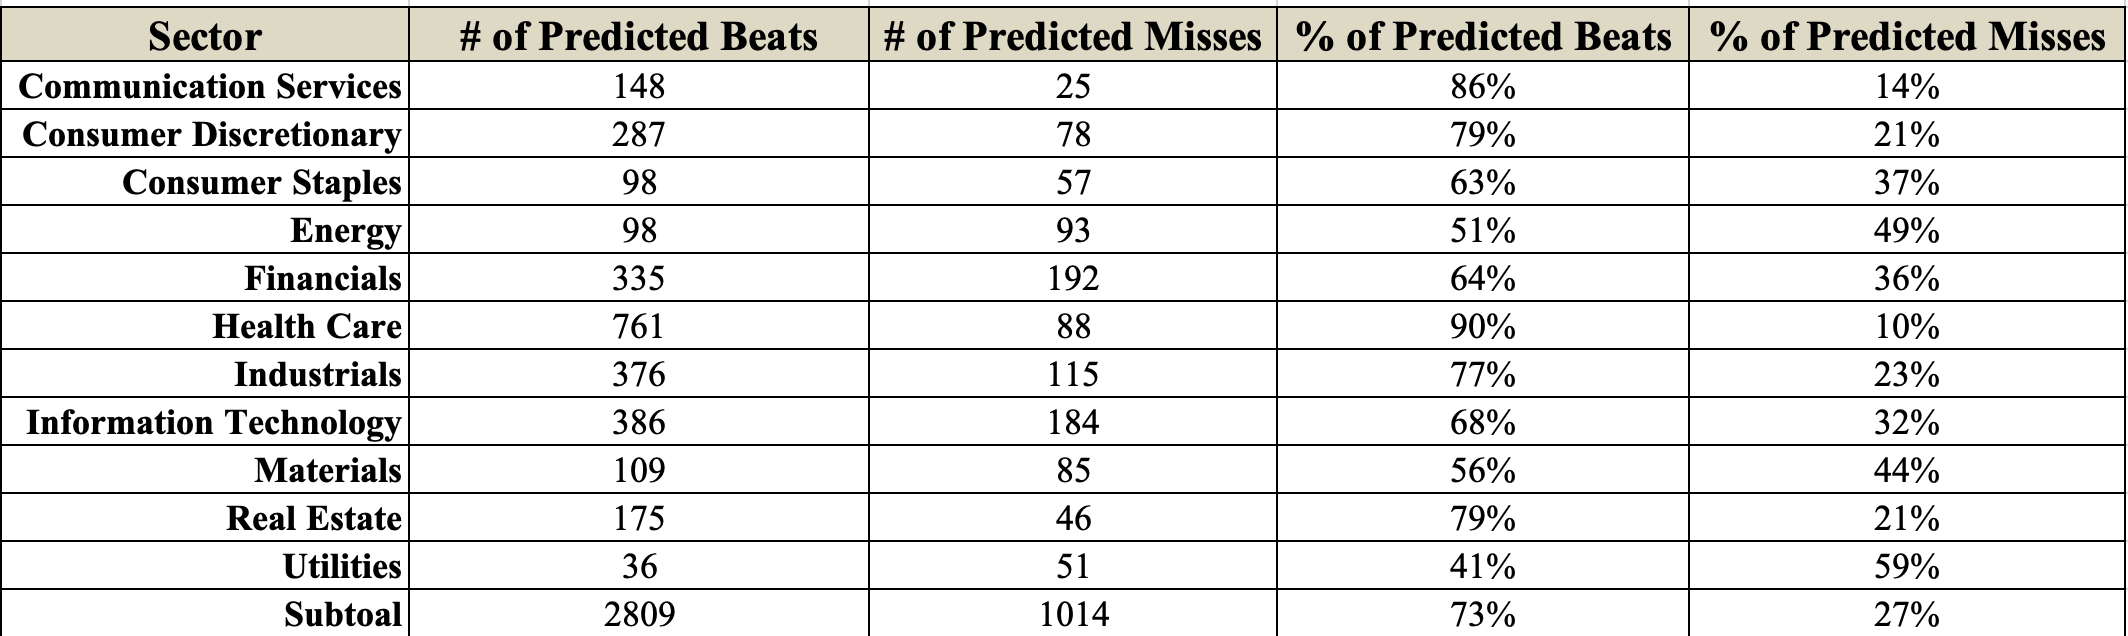
The strongest predicted beat mixes for Q1 are:
Health Care: 761 predicted beats / 88 predicted misses (90% beats)
Communication Services: 148 / 25 (86% beats)
Consumer Discretionary: 287 / 78 (79% beats)
Real Estate: 175 / 46 (79% beats)
Industrials: 376 / 115 (77% beats)
That is a meaningful signal. It says the quarter is not being led by only one pocket of the market. In fact, the broader pattern is closer to earnings breadth than narrow single-theme leadership.
But not all greens are equal.
The weakest Q1 sector outlooks are:
Utilities: 36 predicted beats / 51 predicted misses (41% beats)
Energy: 98 / 93 (51% beats)
Materials: 109 / 85 (56% beats)
Financials: 335 / 192 (64% beats)
Consumer Staples: 98 / 57 (63% beats)
Information Technology sits in the middle at 68% predicted beats, which is decent, but not dominant. That is notable because the external setup briefly argues that tech and AI remain the core thematic debate of the quarter, while sentiment toward the group has softened and the market is demanding better proof of monetization. That matches what the quarter-level outlook is signaling: tech is still constructive, but it is no longer carrying the whole market alone.
The cap-tier message is similarly balanced. Large caps and mid-caps both screen very well on the full-quarter view, while small caps still skew positive but with materially more dispersion. That is important for implementation. If you are running a systematic or event-driven book, the full-quarter map argues for leaning toward large/mid-cap breadth, while still using the small-cap universe as the hunting ground for dispersion and asymmetric setups rather than blunt exposure.
Q1 looks broad enough to support multiple sector winners, but selective enough that factor crowding and quality separation will still matter. The quarter is green. The trade selection still has to be disciplined.
Heatmap

Special Feature: Sector Rotations from Q4 — where the quarter is actually shifting
The rotation table is arguably the most important document in this package because it shows not just what Q1 looks like, but how it is changing relative to what actually happened in Q4.
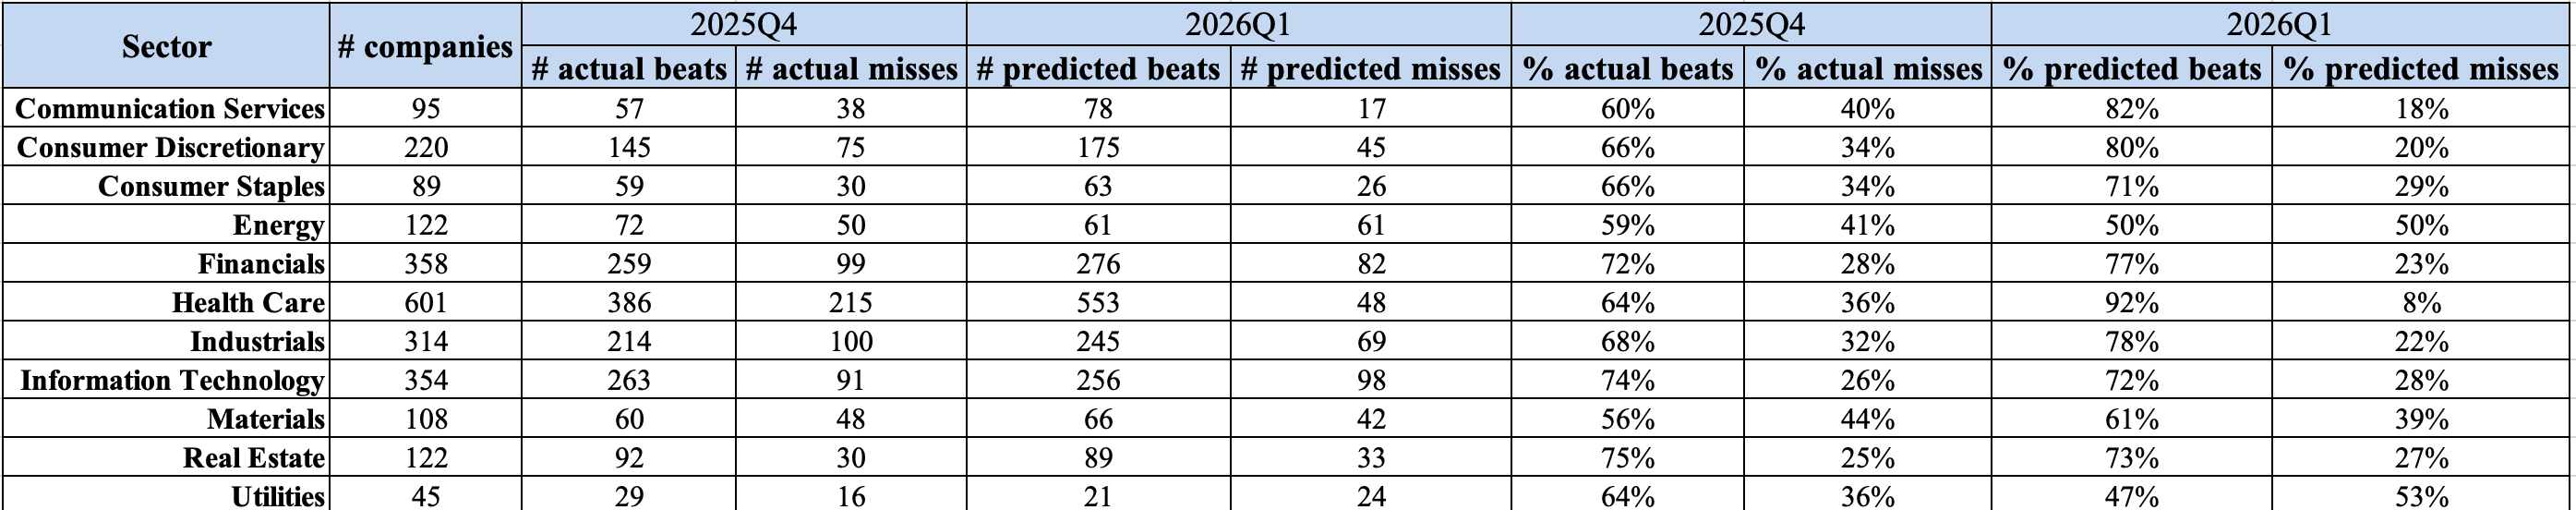
The biggest positive rotations are:
Health Care: from 64% actual beats in Q4 to 92% predicted beats in Q1 (+28 pts)
Communication Services: 60% → 82% (+22 pts)
Consumer Discretionary: 66% → 80% (+14 pts)
Industrials: 68% → 78% (+10 pts)
There are also smaller positive shifts in Materials, Financials, and Consumer Staples, though those are less dramatic and should be treated with more caution.
The negative rotations are just as telling:
Utilities: 64% actual beats in Q4 → 47% predicted beats in Q1 (-18 pts)
Energy: 59% → 50% (-9 pts)
Real Estate: 75% → 73% (-2.5 pts)
Information Technology: 74% → 72% (-2 pts)
That is the rotation story in one line: Q1 is broadening away from pure technology leadership and toward Health Care, Consumer Discretionary, Communication Services, and Industrials, while Utilities and Energy lose altitude.
That does not mean tech becomes irrelevant. It means tech is no longer the only sector that can carry upside surprise. It also reinforces the theme from the setup brief: the market is beginning to ask harder questions about AI capex, AI ROI, and the timing of free-cash-flow conversion. The issue is no longer whether AI remains important. It is whether the earnings season starts to expose a gap between spend and monetization.
For portfolio construction, the implications are practical. Health Care’s huge positive rotation suggests a broader beat tail than many investors may be carrying into the quarter. Industrials remain one of the cleanest repeatable clusters. Consumer Discretionary is improving in a way that matters for stock picking. Meanwhile, Utilities and Energy look like weaker sources of broad upside surprise and better candidates for selective caution.
Market Cap Breakdown
Mega / Large Cap
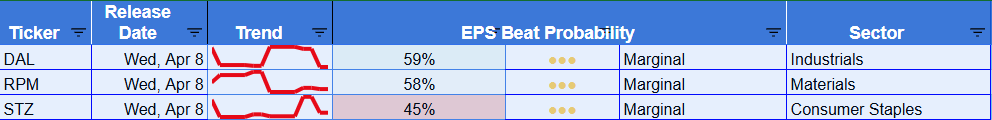
There is no mega-cap leader on this week’s board. The large-cap cohort is only three names: DAL (59%), RPM (58%), and STZ (45%).
That is not enough to create a broad large-cap message. The takeaway is that large-cap reaction risk this week is idiosyncratic, not thematic. DAL and RPM lean modestly positive, but neither is a high-conviction outlier. STZ screens below 50%, which keeps Consumer Staples from offering a clean large-cap read-through.
Mid-Cap
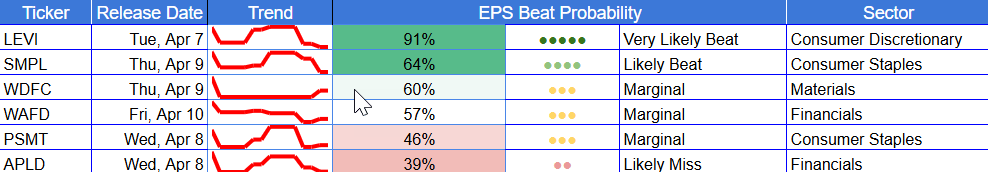
Mid-caps are the strongest cap bucket this week from a tradeability standpoint. LEVI is the standout at 91%, and it is by far the strongest signal on the current board. SMPL (64%), WDFC (60%), and WAFD (57%) are constructive. Against that, PSMT (46%) and APLD (39%) keep the group mixed enough to support relative value rather than simple directional exposure.
This is the cleanest cap tier for week one: enough liquidity to matter, enough dispersion to trade, and one true high-conviction leader in LEVI.
Small Cap
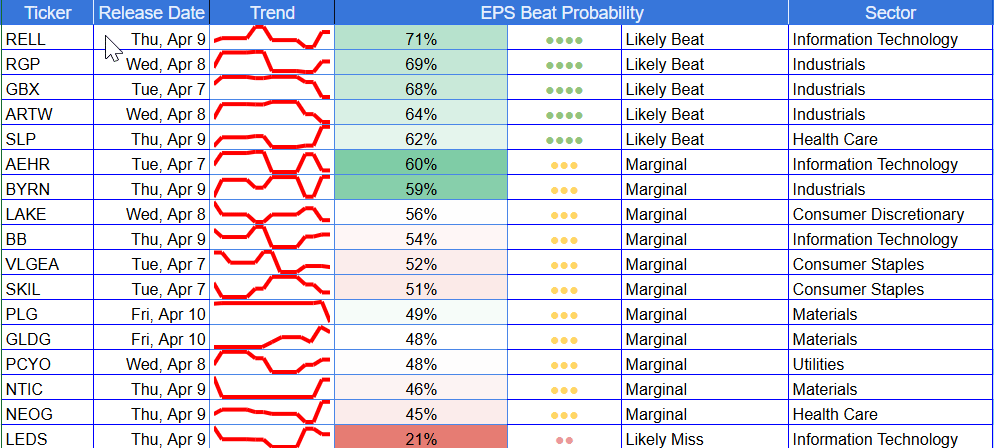
Small caps dominate the week numerically and carry most of the dispersion. This is where the best cluster work sits, but also where signal failure can still be sharp. The positive side is led by RELL, RGP, GBX, ARTW, SLP, and AEHR. The weak tail includes LEDS, NEOG, NTIC, GLDG, PLG, and PCYO.
That makes small caps the best source of relative value rather than blanket exposure. The right framing is not “small caps are bullish.” It is “small caps contain the cleanest upside clusters and the most obvious weak tails.”
Sector Exposure

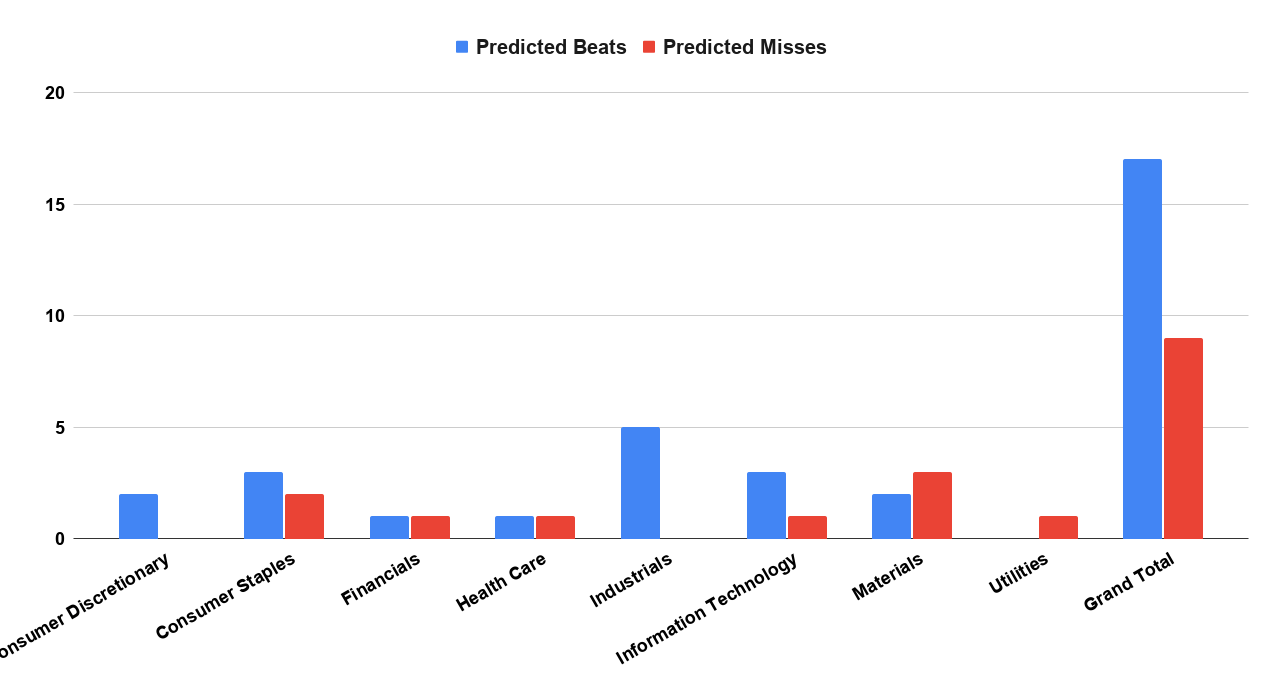
Industrials: best current-week cluster
Industrials is the cleanest sector this week. RGP (69%), GBX (68%), ARTW (64%), BYRN (59%), and DAL (59%) all lean positive. There is no obvious industrial miss pocket in the week-one board, which makes the sector the most internally consistent positive cluster.
Consumer Discretionary: concentrated strength
Consumer Discretionary only has two names, but one of them is LEVI at 91%, which makes the sector one of the most important early read-throughs of the week. LAKE (56%) adds a secondary positive name, but LEVI is clearly the centerpiece.
Information Technology: still bifurcated
Technology remains split. On the positive side, RELL (71%), AEHR (60%), and BB (54%) are constructive. On the weak side, LEDS (22%) remains one of the worst miss setups on the board. That keeps tech in the same framing we have used repeatedly: quality-versus-tail-risk, not broad sector enthusiasm.
Consumer Staples: fragile and deteriorating
This is the sector that changed the most in the wrong direction at the weekly level. SMPL (64%) is still decent, but VLGEA (52%) and SKIL (51%) have decayed sharply, while PSMT (46%) and STZ (45%) are now below 50. The quarter-level outlook still shows Staples positive overall, but week one is telling a different story: signal decay and failed reratings are becoming the more important pattern.
Materials, Financials, Utilities, Health Care
Materials is mixed-to-weak, with WDFC and RPM offset by GLDG, PLG, and NTIC below or near neutral. Financials is not especially attractive, with WAFD mildly positive but APLD clearly weak. Utilities is the weakest current-week pocket through PCYO (48%), which aligns with the weaker quarter-level rotation. Health Care is mixed: SLP (62%) looks fine, but NEOG (45%) does not confirm the quarter’s otherwise strong sector rotation./
Top 6 Beats/Misses - Week of April 6, 2026
Top 6 Beats
LEVI — 91% | Tue, Apr 7 | MidCap | Consumer Discretionary | $8.27B
RELL — 71% | Thu, Apr 9 | Small Cap | Info Technology | $136M
RGP — 68% | Wed, Apr 8 | Small Cap | Industrials | $175M
GBX — 67% | Tue, Apr 7 | Small Cap | Industrials | $1.50B
ARTW — 64% | Wed, Apr 8 | Small Cap | Industrials | $13M
SMPL — 63% | Thu, Apr 9 | Mid Cap | Consumer Staples | $3.29B
Top 6 Misses
LEDS — 21% | Thu, Apr 9 | Small Cap | Info Technology | $17M
APLD — 38% | Wed, Apr 8 | Mid Cap | Financials | $2.69B
NEOG — 44% | Thu, Apr 9 | Small Cap | Health Care | $1.03B
STZ — 45% | Wed, Apr 8 | Large Cap | Consumer Staples | $30.07B
PSMT — 46% | Wed, Apr 8 | Mid Cap | Consumer Staples | $3.37B
NTIC — 46% | Thu, Apr 9 | Small Cap | Materials | $75M
Top Movers (10+ pts) — signal vs. stability
The edge is not just who moved. It is who held.
Upward shifts
RELL: 48.4% → 71.4% (+23.0 pts) — IT
Inventory and capital-efficiency factors improved, with analyst/sentiment changes helping confirm the move.AEHR: 40.0% → 60.0% (+19.9) — IT
Cash/operating-profit and inventory-related drivers improved enough to move the name into beat territory.ARTW: 46.1% → 64.2% (+18.2) — Industrials
Asset-return and inventory-risk drivers strengthened; one of the cleaner small-cap upgrades this week.RGP: 52.3% → 68.6% (+16.3) — Industrials
Cash-flow quality, CFO-bullishness change, and analyst sentiment improved, though the path remains more volatile than the final score suggests.NTIC: 34.6% → 46.1% (+11.5) — Materials
Better efficiency and sentiment inputs helped, but the score still sits below 50, so this is improvement without confirmation.
Downward shifts
PSMT: 93.2% → 45.9% (-47.3 pts) — Consumer Staples
The sharpest failed rerating on the board; inventory-related deterioration appears to be the core issue.VLGEA: 92.3% → 51.6% (-40.7) — Consumer Staples
Still technically positive, but the signal has lost most of its strength.SMPL: 86.3% → 63.5% (-22.8) — Consumer Staples
Still a likely beat, but no longer clean; margin and working-capital durability now matter more.GLDG: 67.7% → 48.4% (-19.3) — Materials
A modest beat case rolled over into marginal miss territory.LEDS: 37.6% → 21.5% (-16.2) — IT
An already weak setup got weaker, led by inventory-heavy risk factors.
What to Watch
First, watch whether Industrials confirms as the cleanest week-one cluster. Second, treat LEVI as the most important current-week print because it is the one true high-conviction name with broader consumer read-through potential. Third, pay close attention to whether the Consumer Staples breakdown is idiosyncratic or the start of a wider demand/margin reset. And fourth, keep the broader quarter frame in mind: the biggest Q1 themes are still AI capex versus monetization, ROI/RPO credibility, earnings breadth versus leadership concentration, and the first real tests of whether softened tech sentiment turns into broader estimate pressure.
Cmind’s edge here is not just directional prediction. It is identifying where breadth, rotation, and signal durability are lining up — and where they are not.
About The Model
Cmind AI’s EPS predictions are powered by a machine learning model built for accuracy, objectivity, transparency, and daily updates with the latest market information. We ingest over 150 variables across five data modalities—including real-time 10-Q filings, earnings transcripts, governance metrics, and peer signals—to provide early, company-specific EPS forecasts.
Our EPS signals are updated daily across 4,400+ U.S. stocks using a multi-input ML model (filings, transcripts, price-to-earnings dynamics, governance, and peer signals). The goal isn’t to predict headlines—it’s to quantify where dispersion is most likely so you can build better baskets, hedges, and sizing into catalyst windows.
📩 To learn more, contact us at [email protected].