- Cmind AI by Weihong Zhang
- Posts
- AVGO in Focus: High-Conviction Beat Call as Tech Drives the Week | Sharp Rise in Cmind EPS Prediction Accuracy Rates
AVGO in Focus: High-Conviction Beat Call as Tech Drives the Week | Sharp Rise in Cmind EPS Prediction Accuracy Rates
Large-cap Tech looks constructive, small-cap convexity is back, and Consumer Discretionary is the funding leg of choice.
John DiBenedetto & Weihong Zhang
December 08, 2025
Welcome to everyone!
Signal Summary
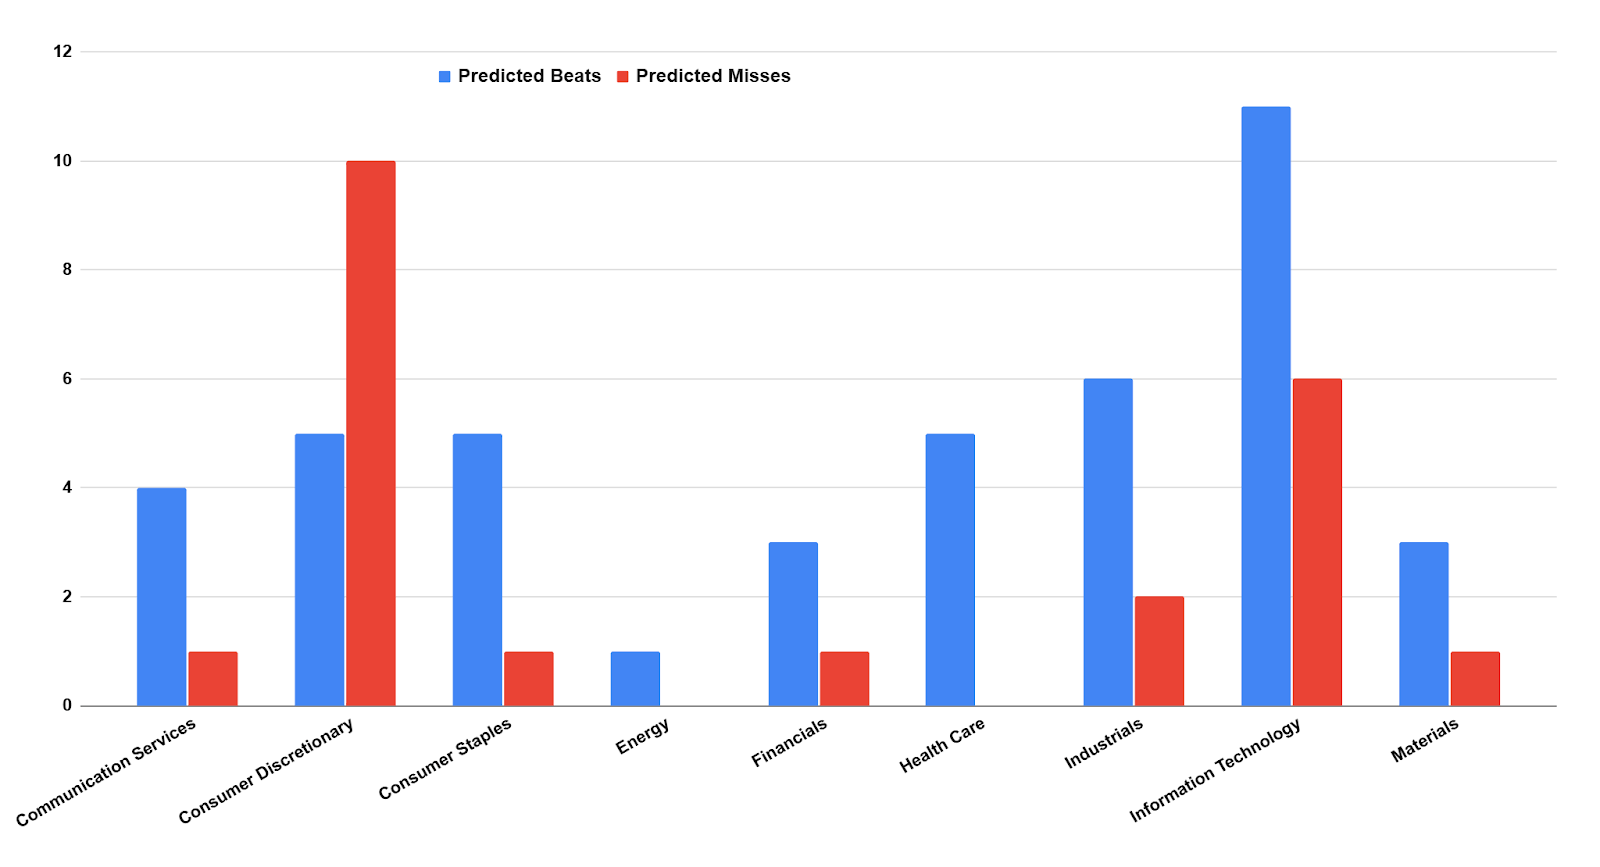
69 names reporting | 17 predicted beats | 6 predicted misses | 46 in the 50-60% "prove-it" band
This week's alpha is in the tails, not the index. The model's probability distribution is wide enough to support differentiated positioning across sectors and cap tiers—but only if you're on the right side of the spread.
On the right tail, platform Tech and digital infrastructure dominate. Large-cap Information Technology carries an average beat probability of 55% across 17 names, but the spread is where the alpha lives: AVGO (see below) and ADBE (79%) sit alongside ORCL (67%) and SNPS (66%) as high-conviction beat candidates. It’s a textbook case of using the model to separate durable platforms from more cyclical or execution-sensitive hardware.
At the other extreme, Consumer Discretionary is the problem child. It’s the only major sector with an average probability below 47-50% across 15 names—and its left tail is loud: THCH (15%, Very Likely Miss), plus AZO (37%), MTN (41%), LAKE (41%), LOVE (42%). The one bright spot is JOUT (71%) in small-cap leisure, underscoring how idiosyncratic the opportunity set has become.
The cap-tier structure reinforces that message. Large caps look constructive at a 59% average with 7 beats vs. 2 misses, a friendly backdrop for stock-specific risk. Mid caps are narrow and guidance-driven—just 5 names, centered near 53%, with CPB (63%) the only clear beat call and MTN (41%) and MANU (49%) reminding you that language and outlook still move the needle. Small caps sit near the same mean (53%) but with the widest tails—from OOMA (94%) down to THCH (15%)—making this the part of the universe where position sizing, borrow, and liquidity constraints matter as much as the signal itself.
Broadcom (AVGO) has an 82% “very likely beat” probability heading into its Dec 11 print. It sits at the crossroads of three themes the engine currently rewards: AI infrastructure, mission-critical networking, and recurring software. On the fundamentals side, AVGO screens in the top tier of its peer group on gross and operating margins, cash conversion, and operating leverage, a profile that historically aligns with positive EPS revision trends into earnings.
On the text side, recent filings and calls score as confident but measured, supporting the earnings case without the kind of promotional tone our language features typically penalize.
The main risks are guide-driven: integration and synergy delivery around large software assets, any slowdown in AI or cloud budget growth into 2026.
Several features dampen the score and explain why AVGO isn’t higher:
Recent Miss (2025Q3): The -$0.09 surprise creates a negative beat/miss value in the “one quarter prior” slot, partially offsetting the strong Q2 outcome.
Margin Trend: Gross margin has been slightly negative over the last two quarters, indicating marginal compression from a very high base.
Return-on-Assets / Equity Metrics: Ratios like EBT/Total Assets and EBT/Equity sit below the 75th percentile, suggesting that while absolute profitability is strong, capital intensity and balance-sheet scale dilute some of the return metrics.
CEO Language Evasiveness: The CEO’s language shows a recent uptick in “evasiveness” relative to self and peers, which our NLP factors treat as a mild caution flag, even as CFO and analyst tone has become more bullish.
Feature of the Week — The Rise in Cmind’s Accuracy Rates (2023–2025)
Over 2023–2025, Cmind’s EPS Predictor has delivered clear, measurable, and accelerating improvements in predictive accuracy, reflecting not just more data but also a meaningfully more innovative architecture. The gains stem from three foundational upgrades to the engine:
(1) More granular language analytics across earnings calls, 10-Q/10-K filings, MD&A tone, and management sentiment vectors, enabling the model to pick up subtle shifts in operating posture—particularly around pricing, cost discipline, and demand elasticity.
(2) Improved modality weighting, including new interaction terms across capital efficiency, accrual patterns, product mix dynamics, and balance-sheet durability. These nonlinear interactions have materially sharpened the model’s sensitivity around margin inflection points and pre-announcement drift.
(3) Daily re-estimation and factor decay, allowing the model to prioritize fresher signals near event windows. This minimizes stale relationships and enhances responsiveness to short-cycle data (e.g., guidance language shifts, FX/commodity deltas, category demand trends).
The December 2025 accuracy dataset quantifies the impact of these enhancements and reveals three notable improvements:
Top-decile predictions are now >80% accurate, up from ~67% two years ago—reflecting materially stronger signal concentration at the right tail.
Miss-cluster detection improved sharply, with bottom-decile accuracy rising from 58% → 72%, strengthening the short and hedge basket.
Directional error magnitude declined, indicating the model is increasingly avoiding the “wrong-sign” errors—where consensus expects strength but fundamentals are deteriorating—often causing the largest drawdowns in long/short portfolios.
Why This Matters
For hedge funds operating in a dispersion-driven tape, accuracy increasingly outranks broad directional conviction. The strongest opportunities now come from high-conviction spreads, not sector beta. Cmind’s high-confidence bands (both top and bottom deciles) have historically delivered superior hit rates and cleaner drift paths, allowing PMs to:
Build beta-neutral alpha capture portfolios,
Enhance pairs and factor-neutral structures, and
Size positions with greater precision around catalyst windows.
Historical data shows that Q4 drift patterns amplify correct calls, particularly when spreads widen seasonally—exactly the setup we are entering now. As liquidity pockets tighten into year-end and volatility disperses across sectors, accurate clustering becomes even more valuable.

The Bigger Picture
The improvements in accuracy strengthen the model’s ability to not only forecast individual beats and misses, but also identify prediction clusters—the thematic structures that repeatedly drive alpha. These patterns include:
Industrials and platform Tech are executing well with stable fundamentals,
Leveraged consumer and long-tail software are structurally weakening,
Capital-intensive subsectors are continuing to fall into red clusters.
The evolution of the Cmind model improves not just forecasting precision but portfolio construction utility, enabling hedge funds to act earlier, size smarter, and stay on the right side of drift.
See how our model tracks the earnings beat, major commentaries, and corporate events daily since its last earnings release.
Information Technology — Platforms vs. Peripherals
IT is a two-tone sector this week:
Right tail - platforms:
AVGO (82%, Very Likely Beat)
ADBE (79%)
ORCL (67%)
SNPS (66%)
DAKT (61%)
These names share strong margin profiles, healthy cash conversion, and increasingly sticky software or subscription elements.
Left tail - peripherals & niche hardware:
CIEN (34%, Likely Miss)
ALOT (38%)
FEIM (40%)
MIND (42%)
ZENV (45%)
Weakness here is tied to less predictable demand, higher capital intensity, and more volatile working-capital trends.
The implication: express IT views as intra-sector spread trades, not directional sector beta.
Industrials carry a moderately positive bias with a 55% average probability:
DLHC (72%), NDSN (65%), and FERG (61%) lead the right side, supported by backlog visibility and disciplined cost control.
On the softer side, ELVA (34%, Likely Miss) and TORO (40%) illustrate the model’s concern around unit economics and capital-intensive product sets.
This is a good hunting ground for post-print drift, where execution names tend to trend once guidance confirms.
Consumer Staples vs. Consumer Discretionary
Consumer Staples skew constructive:
COST (63%), CPB (63%), YQ (52%) highlight the market’s preference for pricing power and predictable volumes.
Even here, score momentum has rolled over in a few cases (e.g., YQ), suggesting some fatigue after a strong run.
Consumer Discretionary is a wide barbell:
JOUT (71%) and selective specialty names screen as solid beat candidates.
The downside tail includes THCH (15%, Very Likely Miss), TOL (46%), MTN (41%), AZO (37%), LAKE (41%), LOVE (42%)—names where our model is picking up pressure from macro sensitivity (rates, housing, travel/leisure) and/or mixed margin carry-through.
Net takeaway: Staples remain the “quality factor in disguise,” while Discretionary is the funding leg for many pairs.
Real Estate, Financials, and Others
Real Estate is surprisingly constructive, led by small-cap names AXR (67%) and MDRR (64%). The model is rewarding stable lease income and manageable debt ladders while shying away from more speculative capital structures.
Financials are mixed:
VBNK (61%) looks solid on credit quality and capital ratios.
HNNA (36%, Likely Miss) sits at the other end, with weaker profitability and more fragile fee dynamics in the feature set.
Communication Services has the highest sector average (61%), but is dominated by one standout: OOMA (94%, Very Likely Beat), which gives the group its green hue.

Large Caps
Right-tail: AVGO (82%), ADBE (79%), ORCL (67%), SNPS (66%), COST (63%).
Left-tail: CIEN (34%, Likely Miss) and AZO (37%) are the primary large-cap miss candidates.
Overall, this tier is constructive but name-specific—you’re paid for single-stock selection, not blanket exposure.
Mid Caps
CPB (63%) is the only labeled beat; REVG (58%), BRZE (53%), MANU (49%), MTN (41%) sit in the “show-me” band.
With no outright predicted misses but several soft scores, mid caps are highly guide-sensitive—post-print dispersion here could widen quickly.
Small Caps
This is where convexity lives:
Right tail: OOMA (94%), DLHC (72%), JOUT (71%), AXR (67%), MDRR (64%).
Left tail: THCH (15%, Very Likely Miss), ELVA (34%), plus marginal names around 0.40.
Size positions to ADV and borrow; this is the tier where 10–20 session drift moves are most pronounced once the tape picks a direction.
TOP PREDICTED BEATS & MISSES - WEEK OF DECEMBER 8, 2025
🔝Top Predicted Beats This Week
OOMA (Dec 8) - 94% - Communication Services - Small Cap
AVGO (Dec 11) - 82% - Information Technology - Large Cap
ADBE (Dec 10) - 79% - Information Technology - Large Cap
DLHC (Dec 10) - 72% - Industrials - Small Cap
JOUT (Dec 12) - 71% - Consumer Discretionary - Small Cap
🔻Top Predicted Misses This Week
THCH (Dec 9) — 15% - Consumer Discretionary - Small Cap
ELVA (Dec 10) — 34% - Industrials - Small Cap
CIEN (Dec 11) — 34% - Information Technology - Large Cap
HNNA (Dec 10) — 36% - Financials - Small Cap
AZO (Dec 9) — 37% - Consumer Discretionary - Large Cap
(As of December 4, 2025)
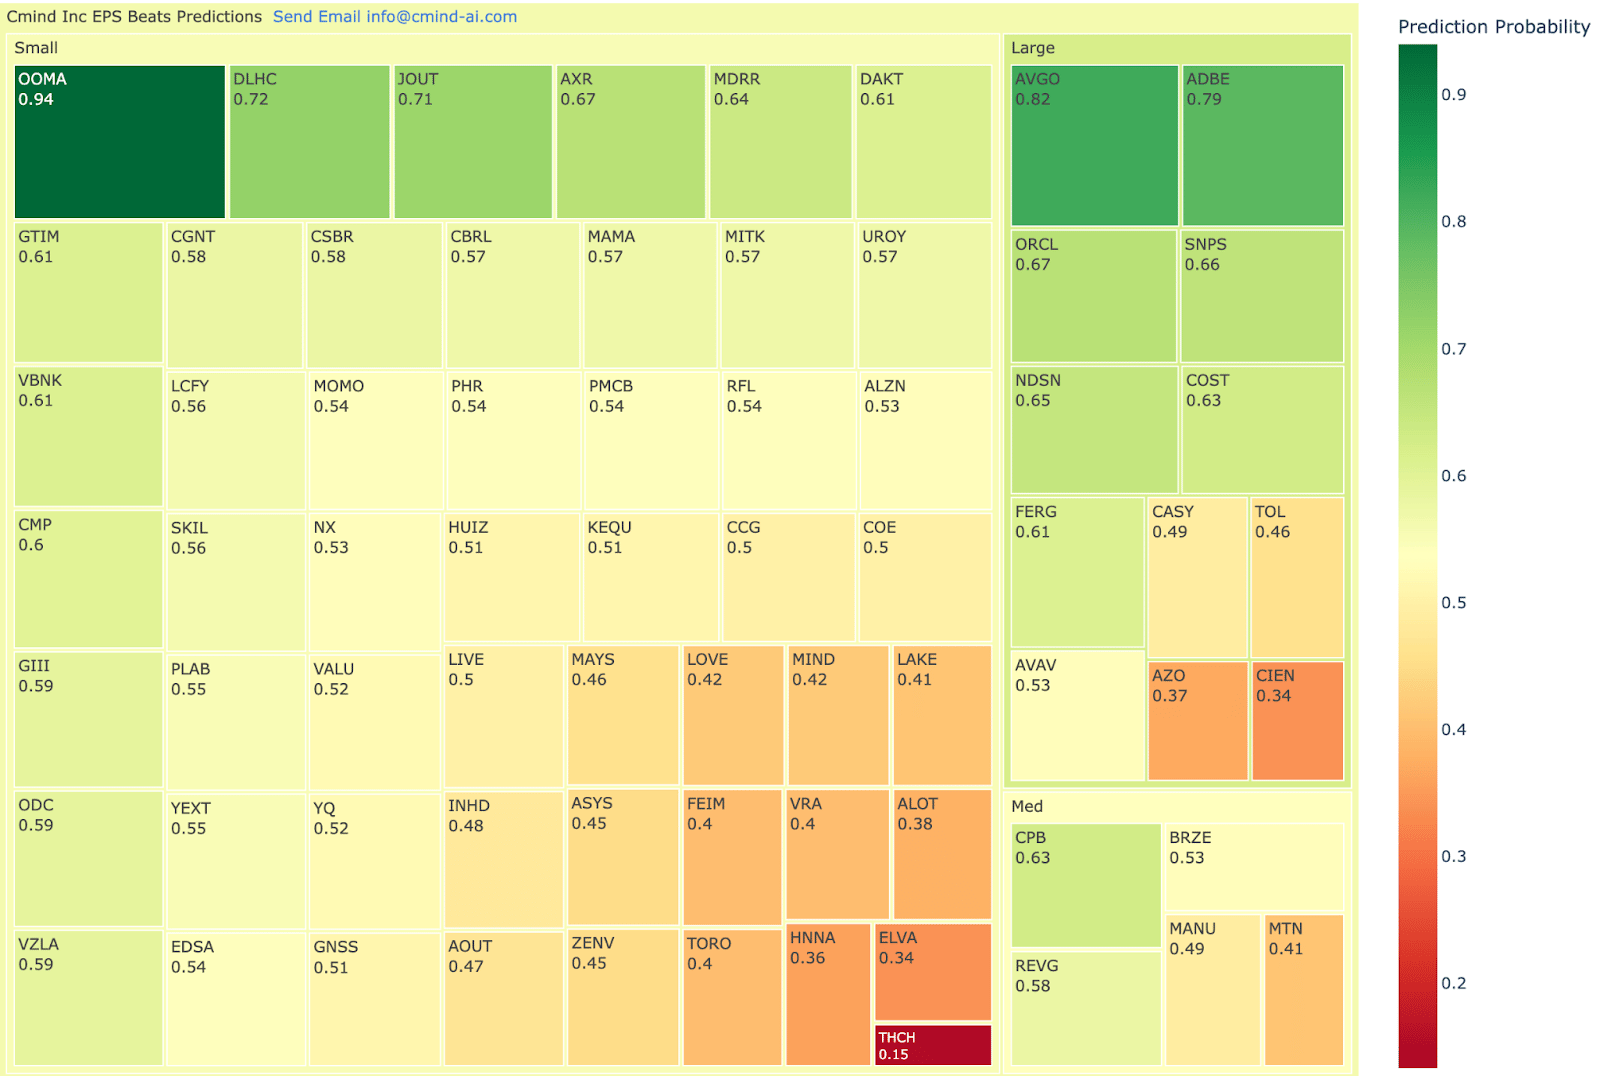
This week’s heatmap is another reminder that the tape is being driven by stock selection, not index beta. The right tail is anchored by OOMA, which prints the strongest signal on the board at 94% beat probability and stands out as a small-cap Communications outlier in a sea of mid-50s probabilities. It’s joined by a cluster of small-cap execution stories—DLHC (72%) and JOUT (71%)—plus AXR and MDRR in the low-to-mid 60s, making the small-cap sleeve the most convex part of this week’s universe.
On the large-cap side, Broadcom and Adobe dominate the Tech block, with Oracle (ORCL, 67%) and Synopsys (SNPS, 66%) reinforcing the idea that platform software and digital infrastructure remain the core of the upside narrative. Nordson (NDSN, 65%) and Costco (COST, 63%) round out a quietly strong group of industrial and Staples names, consistent with the recent rotation toward quality and defensives.
The left tail is equally clear. THCH posts a 15% beat probability, the weakest signal on the map, flagging it as a high-risk Discretionary print. Other notable laggards include CIEN (34%) in large-cap Tech, AZO (37%) in auto parts, and ELVA (34%) and HNNA (36%) among smaller Industrials and Financials. With most of the universe clustered near 50%, these extremes—AVGO/OOMA at one end and THCH/CIEN/AZO at the other—are where the model sees the cleanest opportunities for differentiated earnings alpha this week.
Click here or on the following heat map to see an interactive version.
Next Week & Q4 Setup
The December 15–20 window is a moderate but strategically important stretch of the calendar. It bridges the lighter early-December tape and the heavy January Q4 earnings season, and it lines up with a market that just digested:
Four straight quarters of double-digit S&P 500 EPS growth and the strongest beat rates since 2021.
A rotation away from mega-cap Tech toward defensives like Health Care, Materials, and Staples.
Rising scrutiny on AI capex and stretched valuation multiples with the S&P trading above its 5- and 10-year forward P/E averages.
Against that backdrop, this week’s reporters—Lennar, Micron, General Mills, Nike, Accenture, BlackBerry, Conagra, Paychex, Winnebago, and a handful of smaller caps—offer a clean set of tests:
Can AI hardware and memory stocks justify aggressive growth assumptions?
Is the housing/consumer complex stabilizing or rolling over?
Do defensive Staples and services still deserve their recent leadership premium?
Our Dec 8–13 cross-section showed Tech and Staples with higher average beat probabilities, while Consumer Discretionary lagged, small caps displayed the widest tails. We will carry that template into next week.
Individual Stock Predictions
Large Caps
The right tail in large caps is all about platform Tech and quality defensives. Broadcom (82%) and Adobe (79%) anchor the green cluster, with Oracle (ORCL, 67%) and Synopsys (SNPS, 66%) reinforcing the narrative that digital infrastructure and software remain the core upside engines. Outside Tech, Nordson (NDSN, 65%) and Costco (COST, 63%) extend the strength into Industrials and Staples. On the other side, CIEN (34%) and AZO (37%) sit firmly in the left tail, flagging large-cap names where expectations still look too generous.

MidCaps
Mid caps are fewer but more binary. Campbell Soup (CPB, 63%) leads a small group of constructive signals, supported by REVG (58%) and BRZE (53%) in the “prove-it but skewed positive” band. By contrast, MANU (49%) and MTN (41%) illustrate how quickly the model fades names with softer guidance or more cyclical end-markets. Overall, the mid-cap strip looks narrow and guidance-driven, rather than a broad factor bet.

Small Caps
The small-cap sleeve is where convexity lives. OOMA (94%) prints the strongest signal on the entire map, a standout Communications name in a sea of mid-50s scores. It’s joined by DLHC (72%), JOUT (71%), AXR (67%), and MDRR (64%) as execution stories on the right tail. The left tail is just as sharp: THCH (15%) is the weakest name in the universe, with ELVA (34%) and HNNA (36%) close behind. With most names clustered near 50%, these extremes across cap tiers are where the model sees the cleanest earnings-alpha opportunities this week.

About the Model
Cmind AI’s EPS predictions are powered by a machine learning model built for accuracy, objectivity, and transparency. We ingest over 150 variables across six data modalities—including real-time 10-Q filings, earnings transcripts, governance metrics, and peer signals—to provide early, company-specific EPS forecasts.
Updated daily, our model covers 4,400+ public companies, with proven backtests demonstrating improvements in Sharpe and Sortino ratios across portfolios.
📩 To learn more, contact us at [email protected]