- Cmind AI by Weihong Zhang
- Posts
- Banks: Light the Fuse for Q1 Earnings Season | JPM GS MS BAC Citi - likely beats | Top Movers
Banks: Light the Fuse for Q1 Earnings Season | JPM GS MS BAC Citi - likely beats | Top Movers
Financials - strongest cluster | 16+ Large-cap quality names - 90%+ scores | Credit commentary and AI ROI will determine if rally sticks
Weihong Zhang
April 13, 2026
Cmind Weekly Earnings Update - April 13 – 18, 2026
This is the week Q1 earnings season starts to matter.
The board is one of the strongest weekly setups Cmind has published in recent months. Across the 76 companies on this week’s calendar, 62 screen above 50% beat probability, 47 sit at or above 60%, and the average prediction probability is roughly 67%. But the strength is not evenly distributed. This is a large-cap-led, bank-led, quality-led setup, with the strongest green cluster concentrated in Financials and reinforced by selective Health Care, Real Estate, and Industrials. The weak tail is narrower and more idiosyncratic than the bullish top end.
That matters because this is not just another reporting week. It is the opening read-through for the quarter. The next 30 days will hinge on three issues hedge funds care about most: whether banks confirm the macro and credit backdrop, whether options markets price dispersion correctly into the rest of April, and whether the AI capex/ROI debate becomes the defining valuation battleground of Q1. This week is where those narratives start to reset.
The key takeaway from the heatmap is simple: earnings season is opening from a position of strength, but not from indiscriminate optimism. The strongest signals are clustered in money-center banks, custody banks, diversified financials, and a few large-cap defensive names. The biggest risks sit in a narrower left tail: Consumer Discretionary, lower-quality Information Technology, and sector-specific outliers such as PGR and FAST. This is a tape for ranking quality, not just probability.
Feature of the Week: Banks light the fuse — and set the terms of risk for the rest of April
If last week was about setting up Q1, this week is where the market gets its first real answer on whether that optimism is deserved. The first and most important read comes from the banks. They report first, but more importantly, they sit at the intersection of macro resilience, credit quality, capital-markets activity, and operating leverage. That makes the opening bank cluster the clearest early signal for how investors are likely to frame the rest of April.

The attached Q1 Banks summary image makes the signal unusually clear. Goldman Sachs, Morgan Stanley, JPMorgan, and Bank of America all screen Very Likely Beat, with consensus EPS at $16.48 for GS, $2.99 for MS, $5.46 for JPM, and $0.99 for BAC. The details matter.
Goldman is tied to a thawing M&A and underwriting backdrop, including a more active IPO and deal pipeline. Morgan Stanley’s setup is driven by advisory-fee recovery, robust equity trading, and continued wealth-management growth. JPMorgan brings the broadest macro read-through: fortress-balance-sheet framing, Apple Card integration, corporate activity, and the quality of its reserve posture. BAC is the cleanest bridge between banking and the late-April tech debate, with Erica 2.0, AI-enabled cost saves, trading momentum, and fee diversification all central to the narrative.
That is why this cluster matters. The banks are not merely reporting their own quarters. They are giving the market its first live read on the three questions that will define the next 30 days of earnings.
The first is macro and credit durability. JPMorgan is probably the single most important print on the board here. If Jamie Dimon sounds constructive on consumer balance sheets, reserve discipline, loan demand, and corporate activity, that gives investors a stronger basis to trust the “higher for longer, but stable” regime.
BAC and USB will then help refine that read through rate sensitivity, NII trajectory, and mainstream consumer-credit behavior. In other words, JPM tells you the macro story, BAC and USB help confirm whether it is broad or narrow. That is exactly why the earnings-events brief frames banks as the opening macro and liquidity tell for Q1.
The second is capital-markets reacceleration. Goldman and Morgan Stanley are the most important predictive names for what comes next in brokers, exchanges, asset managers, and the broader risk complex. Goldman’s image-based setup points directly to a revived deal cycle, IPO thaw, and advisory rebound. Morgan Stanley does the same from a slightly different angle: advisory, underwriting, equity trading, and wealth-management operating leverage. If both confirm, it strengthens the case that capital-markets activity is returning as a real earnings driver rather than just a hopeful second-half narrative.
That would matter well beyond the banks themselves; it would be supportive for later prints in capital-light financials, exchanges, market infrastructure, and even selective cyclical growth names.
The third is AI spend versus AI operating leverage. This week is not yet the hyperscaler reporting window, but BAC and JPM are still important here because they show how large enterprises are talking about AI before big tech reports later in April. BAC’s Erica 2.0 rollout and JPM’s Spectrum AI trading platform are not capex stories in the same way as the hyperscalers, but they are early evidence of how investors may judge the next phase of the AI narrative: not just on spend, but on efficiency gains, revenue support, and whether management can point to real ROI.
That is the bridge from this week’s banks to the coming AI-capex and RPO debate the events brief highlights as the dominant cross-sector theme of the quarter.
The practical read-through for the next few weeks is straightforward:
JPM is the best predictor of macro confidence, reserve posture, and whether investors can lean back into risk.
BAC is the best early indicator of consumer resilience, NII durability, and whether AI/digital investments are starting to show operating leverage.
GS is the cleanest read on the health of the deal cycle, underwriting appetite, and institutional risk-taking.
MS is the most useful barometer for advisory recovery, wealth-management trends, and client-activity intensity.
USB, KEY, TFC, and WFC will matter as second-order confirmation names on regional credit conditions, NII sensitivity, and whether the strength is broadening beyond the money centers.
BK, STT, and SCHW provide additional predictive value on custody flows, client engagement, and the strength of fee-driven financial businesses.
The cleanest way to frame the feature is this: banks are the first macro tell, the first credit tell, and the first test of whether earnings season can support multiple expansion rather than just defend it. If the cluster confirms — and especially if JPM, GS, MS, and BAC pair strong numbers with supportive guidance — the market can carry that confidence into later-April tech, AI infrastructure, and broader cyclical earnings.
If the beats arrive but the commentary is cautious, reserve-heavy, or margin-defensive, then this week becomes less a green light and more a warning that the quarter may be fundamentally solid but harder to re-rate.
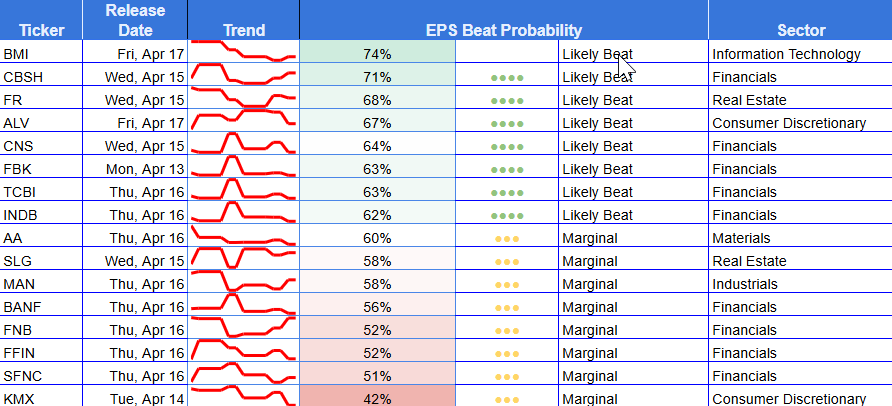
Heatmap

Market Cap Breakdown

Mega / Large Cap

This is emphatically a large-cap week. Large caps account for 33 of the 76 names, carry an average prediction probability above 82%, and contain 16 names at or above 90%. The strongest part of the entire board lives here: JNJ 99%, MS 99%, JPM 98%, WFC 98%, ABT 97%, BK 96%, BAC 95%, PLD 94%, SCHW 94%, C 94%, BLK 94%, GS 94%, and PNC 93%.
That concentration is important. This is not a small-cap speculation board pretending to be broad. It is a week where large, liquid, institutionally relevant names are doing the heavy lifting. The edge is not hidden deep in the tail. It is visible in the large-cap cluster.
The risk inside large cap is much narrower but still real. PGR at 16% and FAST at 18% are the two obvious large-cap outliers on the downside. That tells you something important about this week’s risk map: broad large-cap weakness is not the story; idiosyncratic large-cap miss risk is.
MidCap
Mid caps are much more balanced. The average probability is right around 60%, with no names above 90% and none below 40%. That makes the group more usable for relative value than for headline conviction. The top names are constructive but not explosive, while the bottom end is weaker but not outright broken.
In practice, mid caps look like the “secondary expression” tier this week. They matter, but they are not leading the tape. The large-cap bank and defensive cluster remains the primary source of conviction.
Small Cap
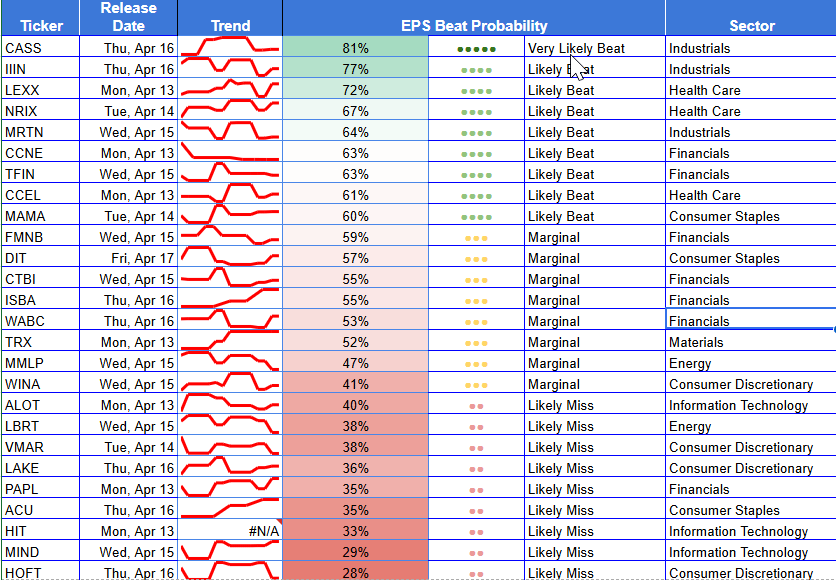
Small caps are where the dispersion lives. The average probability drops to about 52%, and 9 of the 27 small-cap names sit below 40%. That is where the weak tail concentrates: HOFT, MIND, HIT, LAKE, VMAR, LBRT, and others.
At the same time, small caps are not uniformly weak. There are still selective positives such as NRIX, LEXX, CASS, IIIN, and a few smaller industrial and health care names. But this is not a week to treat small caps as a single risk bucket. They are the source of tactical asymmetry, especially on the short side
Sector Breakdown
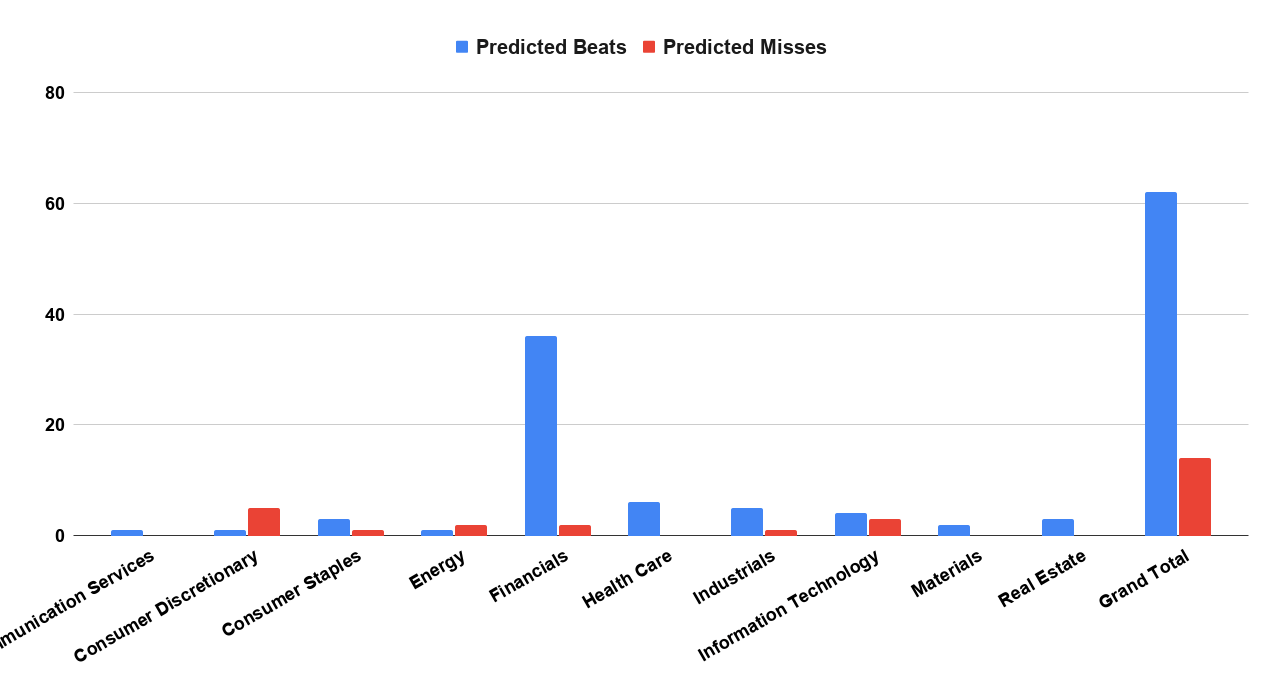
Financials: the clear leadership sector
Financials are the core of the week. The sector has 38 names on the board, an average probability near 74%, and 28 names above 60%. The top end is exceptional: MS, JPM, WFC, BK, BAC, C, GS, SCHW, PNC, STT, KEY, USB, CFG, FITB, and TRV all screen strongly.
The important nuance is that this is not just a money-center trade. The green cluster extends into asset managers, custody banks, brokers, and regionals. That makes the sector useful both as a headline feature and as a basket expression. The two notable exceptions are PGR and PAPL, both of which sit in miss territory and remind readers that even inside the strongest sector, not every name belongs in the same bucket.
Health Care: high-quality support
Health Care is the second-cleanest sector by average probability, led by JNJ at 99% and ABT at 97%. The rest of the group is constructive, though less emphatic: LEXX 72%, NRIX 67%, CCEL 61%, BMRA 54%. This is a smaller but high-quality cluster, and it adds defensive ballast to the board.
Industrials: strong top end, one major landmine
Industrials are constructive overall, led by JBHT 91%, CASS 81%, IIIN 77%, and MRTN 64%. But the sector also contains the most obvious industrial miss setup of the week: FAST at 18%. That makes Industrials usable, but with more selectivity than Financials.
Information Technology: bifurcated again
Technology is not outright weak, but it is split. The positive side includes TSM 78%, ASML 74%, BMI 74%, and WIT 60%. The negative tail includes HIT 33%, MIND 29%, and ALOT 40%. This remains a quality-versus-tail-risk sector, not a broad “buy tech” message.
Consumer Discretionary: weakest sector on the board
This is the most obviously weak sector this week. ALV at 67% is the lone clean positive. The rest of the group leans defensive-to-negative: KMX 42%, WINA 41%, VMAR 38%, LAKE 36%, HOFT 28%. There is no large-cap ballast here, and the sector carries one of the clearest miss clusters on the board.
Real Estate, Staples, Energy, Materials, Communication Services
Real Estate is solid through PLD 94%, with FR 68% and SLG 58% constructive. Consumer Staples is mixed, with PEP 88% offset by ACU 35% and middling signals in MAMA and DIT. Energy is split between KMI 83% and weaker setups in MMLP 47% and LBRT 38%. Materials are neutral to mixed. Communication Services is basically a one-name sector this week through NFLX at 52%, which is too marginal to drive a narrative on its own.
Top 6 Beats/Misses - Week of April 13-18, 2026
Top Beats
JNJ — 99% | Tue, Apr 14 | Large | $393.9B | Health Care
MS — 99% | Wed, Apr 15 | Large | $225.0B | Financials
JPM — 98% | Tue, Apr 14 | Large | $809.5B | Financials
WFC — 98% | Tue, Apr 14 | Large | $259.7B | Financials
ABT — 97% | Thu, Apr 16 | Large | $215.2B | Health Care
BK — 96% | Thu, Apr 16 | Large | $69.7B | Financials
Top Misses
PGR — 16% | Wed, Apr 15 | Large | $144.5B | Financials
FAST — 18% | Mon, Apr 13 | Large | $52.9B | Industrials
HOFT — 28% | Thu, Apr 16 | Small | $113M | Consumer Discretionary
MIND — 29% | Wed, Apr 15 | Small | $59M | Information Technology
HIT — 33% | Mon, Apr 13 | Small | $63M | Information Technology
ACU — 35% | Thu, Apr 16 | Small | $158M | Consumer Staples
Top Movers (10 pts+ - Week over Week)
The top upward shifts are dominated by large-cap quality and early-season leadership:
JBHT +44 pts, PLD +43, KMI +39, KEY +37, TRV +36, C +35, MS +33, JPM +32, WFC +32, JNJ +31, BAC +31.
The broader message is clear: the market is rerating transport/logistics, financials, selective defensives, and a few energy/real-asset names into earnings.
The sharpest downward shifts show where conviction has broken:
PGR -40 pts, FAST -25, WIT -25, LAKE -20, TSM -17, ALV -17, LEXX -12.
A few of these matter more than the absolute move suggests. PGR is the most important because it breaks sharply lower inside the strongest sector on the board. FAST matters because it is the industrial sector’s main negative outlier. TSM is still a likely beat, but the drop from the mid-90s into the high-70s tells you the market is getting less comfortable with giving premium credit to the semiconductor complex before the broader AI earnings debate begins.
What To Watch
First, watch whether the bank cluster confirms not just on EPS, but on guidance quality. Second, watch the gap between strong beats and stock reactions; that will tell you whether the market wants confirmation or already expects it. Third, monitor whether Technology’s better-quality names can hold while lower-quality names continue to weaken. And fourth, keep the late-April setup in mind: this week is the opening act for the broader fight over AI capex, AI ROI, RPO credibility, and whether the market will continue funding big-spend narratives without cleaner evidence of monetization.
About The Model
Cmind AI’s EPS predictions are powered by a machine learning model built for accuracy, objectivity, transparency, and daily updates with the latest market information. We ingest over 150 variables across five data modalities—including real-time 10-Q filings, earnings transcripts, governance metrics, and peer signals—to provide early, company-specific EPS forecasts.
Our EPS signals are updated daily across 4,400+ U.S. stocks using a multi-input ML model (filings, transcripts, price-to-earnings dynamics, governance, and peer signals). The goal isn’t to predict headlines—it’s to quantify where dispersion is most likely so you can build better baskets, hedges, and sizing into catalyst windows.
📩 To learn more, contact us at [email protected].