- Cmind AI by Weihong Zhang
- Posts
- CapEx Visibility Week: where dispersion is actually hiding | HOOD & Crypto | Top Movers
CapEx Visibility Week: where dispersion is actually hiding | HOOD & Crypto | Top Movers
After AMZN/GOOGL reset the AI spend bar, the tape pivots from “who’s spending” to “who converts spend into durable cash flow” — and which downstream beneficiaries screen cleanest
John DiBenedetto & Weihong Zhang
February 09, 2026
Hi, Welcome to the Cmind Earnings Edge.
Earnings season is transitioning from the “Mag 7 gravity well” into a broader reaction-function regime: the market is no longer rewarding AI storytelling by default — it’s rewarding visibility, throughput, and ultimately cash generation. Last week’s AMZN/GOOGL results pulled CapEx back to the center of the equity conversation, not as a macro talking point but as a near-term margin lever and a medium-term free-cash-flow arc driver.
This week (Feb 9–13), the board is still dispersion-first. Only about 4.5% of the universe screens ≥80% beat probability, while the left tail remains concentrated in smaller, more idiosyncratic names — a setup where guidance language can gap the distribution more than the EPS line.
Selected large and visible prints:
Tue 2/10: AZN 95%, KO 71%, DDOG 59%, NET 47%
Wed 2/11: CSCO 91%, SHOP 82%, MCD 50%
Thu 2/12: AMAT 93%, ABNB 67%, COIN 64%, ROKU 61%
FEATURE: HOOD + the crypto/retail-risk tape

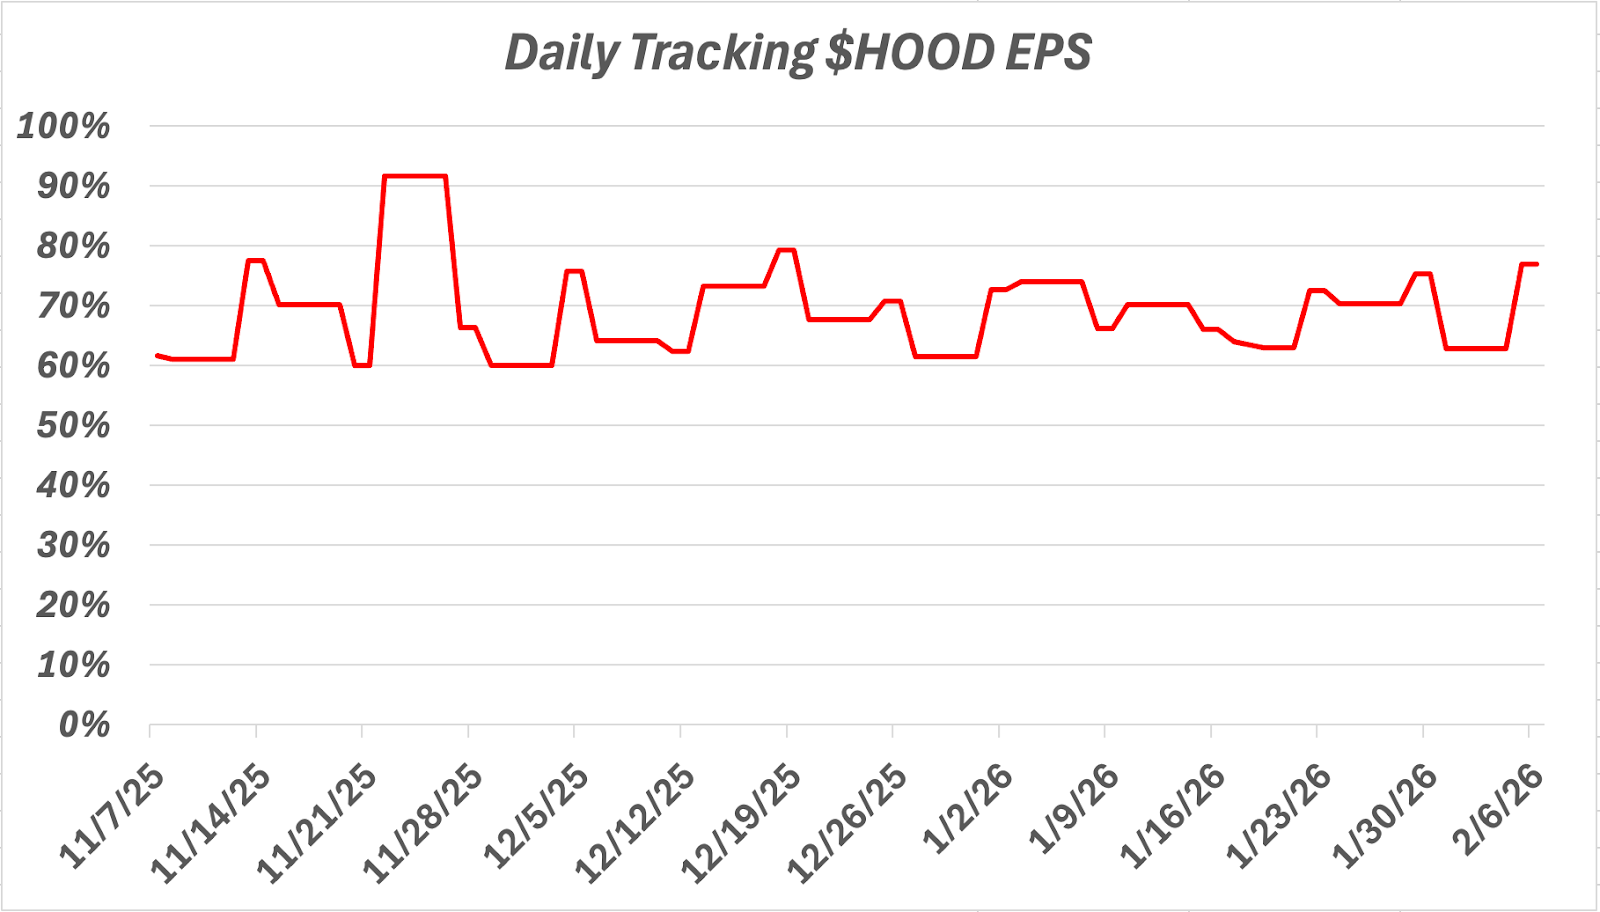
Last week was a rough tape for high-beta tech (AI/Mag 7, SaaS) and crypto-linked names—even with a sharp Friday recovery. That’s why HOOD’s 2/10/26 (after the close; call ~5pm ET) print matters: it’s increasingly treated as a clean read-through on retail risk appetite, crypto sensitivity, and the durability of transaction-led revenues. Consensus EPS: $0.62.
What Cmind’s daily path is saying (from the HOOD tracking chart below): the signal has lived mostly in the 60–70% band for months, with a brief late-2025 spike above that range, and it re-accelerates into the print (high-70s). Translation: the quarter may be “fine,” but the tape will still grade the guide and the quality of revenue.
Why this is tradeable: HOOD is expanding deeper into crypto and positioning itself as a scaled broker—not just a meme-era app. The reaction is likely to hinge on mix + operating leverage, not the EPS line alone.
Quick checklist
Revenue mix: transaction (options/crypto/equities) vs net interest revenue vs subscription/recurring
Customer growth: net new funded accounts, MAUs, assets under custody
Activity sensitivity: options contracts, crypto volumes, equity/ETF volumes; how tied is it to realized volatility?
Efficiency scoreboard: operating margin / incremental margins; tech & ops spend % of revenue
AI/product roadmap: updates on FinCrimes Agent / Cortex / custom scans and whether they’re showing up as measurable productivity + safety gains
CapEx lens: CapEx isn’t provided in this HOOD file, so the “investment intensity” proxy is mainly tech/ops spend + automation-driven cost efficiency. Watch whether management frames investment as measurable outputs vs open-ended spend.
Bottom line: HOOD is a “retail-cycle + crypto exposure” barometer this week—expect dispersion to be driven by guide clarity, not just the print.
Top Beats and Misses for the Week of February 9, 2026
Top 6 Beats
AZN — 95% (Health Care, 2/12)
AMAT — 93% (Information Technology, 2/12)
CSCO — 91% (Information Technology, 2/11)
INBS — 90% (Health Care, 2/11)
STAA — 86% (Health Care, 2/11)
AVNT — 86% (Materials, 2/10)
Top 6 Misses
AIHS — 18% (Financials, 2/13)
GIG — 19% (Communication Services, 2/13)
TSE — 20% (Materials, 2/12)
MERC — 20% (Materials, 2/12)
PMNT — 21% (Consumer Discretionary, 2/13)
BENF — 23% (Financials, 2/12)
Heatmap

This week’s board is still a dispersion tape (stock selection > index beta), but the signal is less “all-green” and more barbelled: a concentrated right tail in Health Care, pockets of strength in large-cap Tech infrastructure, and a wider, messier left tail that’s mostly small-cap + idiosyncratic.
Overall shape
The model is centered in the low-60s on average, with a thin >80% right tail (~4–5% of names) and a fatter ≤40% left tail (~11% of names). Translation: this is a “guide matters” week—fewer “easy beats,” more reaction-function risk.
Market cap exposure

Large cap
Signals are generally less extreme; reactions often guide-driven vs print-driven.
Mid cap
Dispersion is meaningful, but liquidity usually supports basket construction.
Small cap
Left tail lives here: bigger probability resets, wider forward ranges, larger gap risk.
Translation: the week’s “surprise risk” is asymmetric by cap. The right tail exists across caps, but true blow-up risk is concentrated in small caps — where one line of guidance can overpower the quarter.
Sector exposure

Health Care
Highest average probability and the most ≥80% names. Broad “execution premium” behavior supports basket work. Standouts: AZN 95%, INBS 90%, STAA 86%, AORT 85%.
Information Technology
Several of the week’s highest-confidence signals (AMAT 93%, CSCO 91%, AMKR 84%, TOST 83%) are consistent with “infrastructure with visibility.” But Tech also has left-tail pockets (e.g., LSPD 30%, CHGG 32%, XNET 33%) → selectivity > blanket risk-on.
Industrials
Not the strongest average, but it dominates the movers list — a tell that the tape is actively repricing execution/backlog narratives. This reads “gap-prone” rather than trend-like.
Financials
Broadly moderate, but left-tail risk appears in smaller names (AIHS 18%, BENF 23%) — more company-specific than macro-rate driven.
Top Movers (±10 points over ~5 trading days)
✅ Upward shifts
MTW +39 pts (31% → 71%) — Industrials
MOD +27 pts (32% → 59%) — Consumer Discretionary
SRRK +27 pts (38% → 65%) — Health Care
BNED +20 pts (39% → 59%) — Consumer Discretionary
AVNT +17 pts (69% → 86%) — Materials
SN +17 pts (67% → 84%) — Consumer Discretionary
IX +16 pts (64% → 80%) — Financials
MAR +15 pts (50% → 65%) — Consumer Discretionary
METC +15 pts (38% → 54%) — Energy
⚠️ Downward shifts
POWW −46 pts (93% → 47%) — Industrials
SAIA −37 pts (91% → 54%) — Industrials
WCC −33 pts (91% → 58%) — Industrials
WTS −30 pts (87% → 57%) — Industrials
AEE −29 pts (80% → 51%) — Utilities
WCN −29 pts (77% → 48%) — Industrials
ENB −29 pts (91% → 62%) — Energy
HAS −28 pts (83% → 55%) — Consumer Discretionary
The mover tape this week is telling you where the market is re-weighting risk, not where the headlines are loudest. Two things stand out:
Confidence ramps are concentrated and late-cycle. The biggest upside movers are not broad sector effects—they’re single names where the model is absorbing incremental inputs and pulling probability upward quickly. That pattern usually shows up when expectations are being re-anchored into the print (i.e., the forward range is tightening). These are names where “the quarter can be fine” is no longer the edge—the edge is whether the guide confirms the re-rating.
Downside resets are signaling reaction-function risk. The sharp negative movers (notably in Utilities/Industrials pockets) look like “fragility flags”—probability is being marked down even before the event, which often correlates with wider post-print dispersions. In these setups, the EPS line is rarely the whole story; the tape trades how management frames demand, cost cadence, and forward visibility.
Movers are your risk map. The right tail still exists (Health Care + a few large-cap Tech infrastructure names), but the market is increasingly paying for clarity rather than “good numbers.”
Setup for next week (Feb 16–20)
Next week shifts toward large-scale consumer/retail + housing read-throughs (e.g., WMT, HD), plus additional industrial/tech prints that will either validate or challenge the “CapEx downstream beneficiaries” narrative.
Two things to carry forward:
CapEx visibility remains the gating variable. Quantified outputs → dispersion compresses; vague bridges → dispersion widens.
NVDA (2/25) stays the next major “AI scoreboard” print; this week’s infra + consumer reactions help calibrate how tight that distribution should be.
Options - Notes
IV crush risk is highest where the pre-print distribution looks tight and the signal is stable/high—think AZN (95%), AMAT (93%), CSCO (91%): unless the guide introduces a new narrative, vol often comes out fast post-event.
The better “IV-surprise” candidates tend to be names with big probability resets (distribution widening): AEE (-36 pts), EXC (-29), ANET (+24), CSCO (+18)—these are the setups where guidance language can produce discontinuous gaps that don’t “respect” the straddle.
For index traders, the heatmap skew reads like XLV/XLK leadership vs XLU pressure matters more than SPX beta this week.
About the Model
Cmind AI’s EPS predictions are powered by a machine learning model built for accuracy, objectivity, transparency, and daily updates with the latest market information. We ingest over 150 variables across five data modalities—including real-time 10-Q filings, earnings transcripts, governance metrics, and peer signals—to provide early, company-specific EPS forecasts.
Our EPS signals update daily across 4,400+ U.S. stocks using a multi-input ML model (filings, transcripts, price/earnings dynamics, governance, and peer signals). The goal isn’t to predict headlines—it’s to quantify where dispersion is most likely so you can build better baskets, hedges, and sizing into catalyst windows.
📩 To learn more, contact us at [email protected]