- Cmind AI by Weihong Zhang
- Posts
- CEG Signal +23 pts: AI Moves From Chips to Electrons
CEG Signal +23 pts: AI Moves From Chips to Electrons
780 earnings prints | Industrials lead | Large caps screen cleanest | Small-cap miss-risk remains elevated | STE, ESP, APEI, SPIR, VRME, and ACHR lead the beats
Weihong Zhang
May 11, 2026
Cmind Weekly Earnings Update - May 11 - 17, 2026
This is a second-tier but alpha-rich earnings week. The May 11–17 tape has fewer megacap prints, but it is dense with AI-adjacent, industrial, software, energy, and small/mid-cap names where guidance revisions, sentiment shifts, and post-print drift can matter more than the headline EPS result. For systematic and quantamental investors, the setup is less about broad market direction and more about where the model is detecting dispersion before the print.
Cmind’s heatmap shows a broad but uneven earnings setup across roughly 780 companies. The average beat probability is approximately 54.0%, with about 60.5% of companies carrying a beat label. Only 12.5% screen above the 70% high-conviction beat threshold, while 15.9% sit below the 40% miss-risk threshold. That distribution points to a cleaner long/short environment than a broad beta call: large caps carry the strongest signal quality, Industrials lead sector strength, and the highest risk pockets remain in Financials, Energy, Real Estate, Utilities, Materials, and lower-quality small caps.
The Feature of the Week is Constellation Energy ($CEG), because the AI trade is expanding from chips and hyperscaler capex into electricity, nuclear reliability, and contracted power demand. CEG’s EPS-beat probability rose from 45.8% to 68.9% over the forecast window, including a late jump from 48.1% on May 7 to 68.9% on May 9. That +23.0 percentage-point net move creates a tactical positive setup into earnings, but the real post-print question is whether CEG can convert AI/data-center power demand into durable contracted earnings power.
This week’s signal map: CEG tests the “chips to electrons” trade, STE, ESP, APEI, SPIR, VRME, and ACHR lead the beat screen, while ASTC, FTHM, IPWR, EU, NOA, and CWD carry the highest miss-risk. The top score movers also matter: SPIR +51 pts, BWEN +43 pts, HYLN -43 pts, and ASMB -40 pts.
Feature of the Week: $CEG — From Chips to Electrons
Constellation Energy reports Q1 2026 earnings on May 11, with consensus EPS of $2.56. The market setup is increasingly important because CEG sits at the intersection of three themes that matter to hedge funds and systematic equity strategies: AI data-center load growth, nuclear fleet reliability, and the durability of contracted power economics.
The investment question is not simply whether CEG beats Q1 EPS. It is whether the company can convert favorable power-market conditions into durable earnings power. Investors will be watching forward guidance, nuclear fleet availability, realized power prices, contract pipeline and duration, data-center or industrial power demand exposure, operating cost inflation, regulatory/tax risk, balance-sheet leverage, free cash flow durability, and capital allocation.
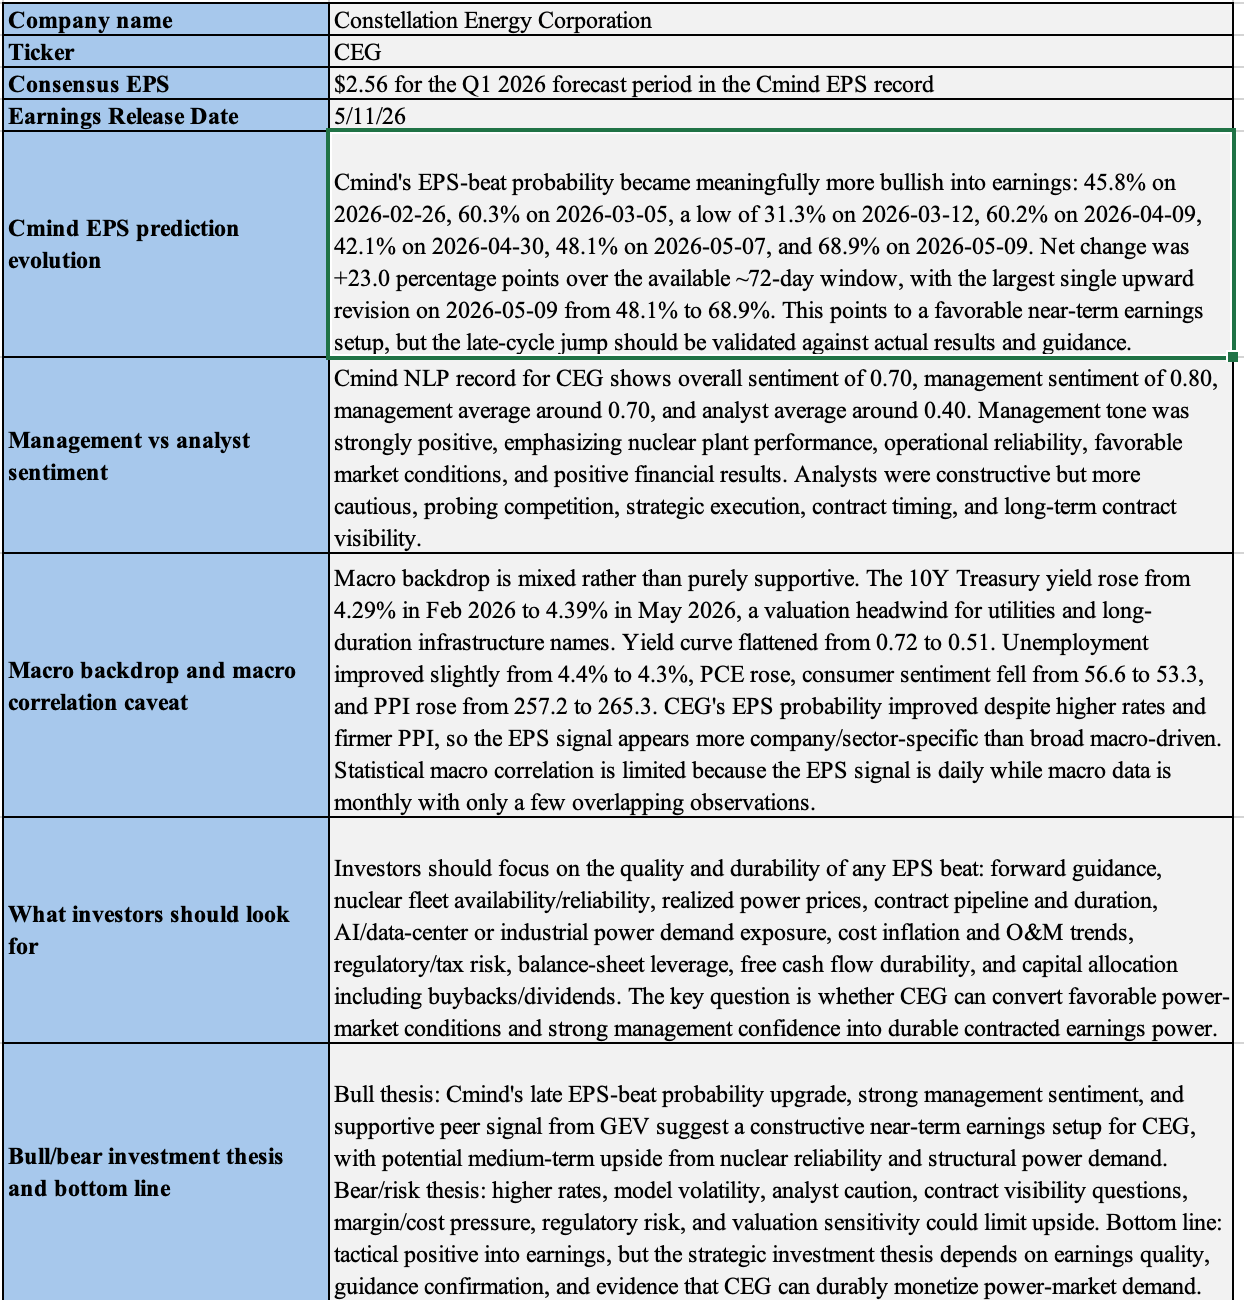
Cmind’s CEG signal became meaningfully more bullish into earnings. The EPS-beat probability moved from 45.8% on February 26 to 60.3% on March 5, then fell to a low of 31.3% on March 12. After rebuilding through April, the signal stood at 48.1% on May 7 before jumping to 68.9% on May 9. The net move was +23.0 percentage points over the available roughly 72-day window, with the largest single upward revision coming in the final pre-print update.
That late-cycle upgrade matters. It points to a favorable near-term earnings setup, but it also raises a validation question: is the move supported by results, guidance, and contract visibility, or is it a pre-print signal that still needs confirmation from management commentary?
The sentiment split is also notable. Cmind’s NLP record for CEG shows overall sentiment of 0.70, management sentiment of 0.80, management average around 0.70, and analyst average around 0.40. Management tone has been strongly positive, emphasizing nuclear plant performance, operational reliability, favorable power-market conditions, and positive financial results. Analysts were constructive but more cautious, focusing on competition, strategic execution, contract timing, and long-term contract visibility.
The macro backdrop is mixed rather than purely supportive. The 10-year Treasury yield rose from 4.29% in February 2026 to 4.39% in May 2026, which is a valuation headwind for utilities and long-duration infrastructure names. The yield curve flattened from 0.72 to 0.51, while PPI rose and consumer sentiment weakened. CEG’s EPS probability improved despite higher rates and firmer inflation inputs, suggesting the signal is more company- and sector-specific than broad macro-driven.
The bull thesis is straightforward: CEG’s late EPS-probability upgrade, strong management tone, and supportive power-demand narrative suggest a constructive near-term setup. The strategic upside comes from nuclear reliability, data-center power demand, and the possibility that CEG becomes a durable AI infrastructure beneficiary. The bear case is also clear: higher rates, valuation sensitivity, contract visibility questions, cost pressure, regulatory risk, and the possibility that AI-related power demand is already embedded in expectations.
Bottom line: CEG screens tactically positive into earnings, but the post-print reaction will likely depend less on the EPS print alone and more on whether management confirms durable contracted earnings power.
Heatmap

Market Cap Exposure
Large Cap
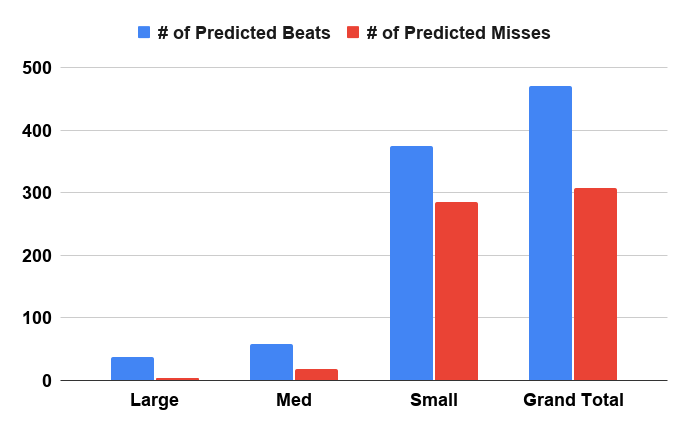
Large caps show the cleanest setup this week. The large-cap cohort has an average beat probability of 67.7%, with 90.5% of names carrying a beat label and 45.2% above the 70% high-conviction threshold. Only 2.4% of large caps fall below the 40% miss-risk threshold.
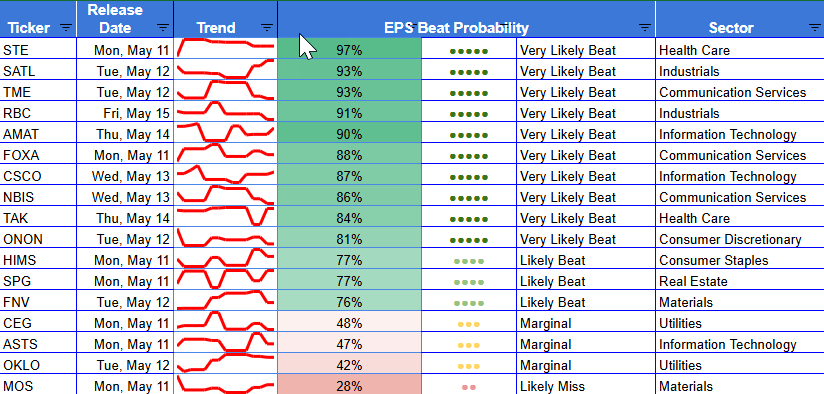
The highest-quality large-cap signals include STE, TME, RBC, AMAT, FOXA, CSCO, ONON, NBIS, and OVV. The key takeaway is that large-cap signal quality remains materially better than the broader universe. For portfolio managers, this supports using large-cap names as the “quality long” side of the week’s earnings basket.
Mid Cap

Midcaps carry an average beat probability of 60.8%, with 75.3% beat-labeled and 27.3% above the 70% threshold. Midcaps are not as broadly green as large caps, but they offer attractive dispersion. ACHR, EVEX, ENVX, CAE, STN, ACM, SGHC, ATAT, and BOOT screen well, while weaker pockets remain in smaller cyclicals and lower-quality growth names.
Small Cap

Small caps dominate the reporting universe with 660 names, but the average beat probability is only 52.3%. Just 8.6% of small caps screen above 70%, while 17.7% fall below the 40% miss-risk threshold. This is the noisiest part of the tape and the area where liquidity, balance-sheet quality, and factor exposure matter most.
Small-cap upside is visible in names such as ESP, APEI, SPIR, VRME, EWCZ, DCO, MHH, SKYX, and KRNT. The downside tail includes ASTC, FTHM, IPWR, EU, NOA, CWD, LODE, ALBT, and PW.
Sector Exposure
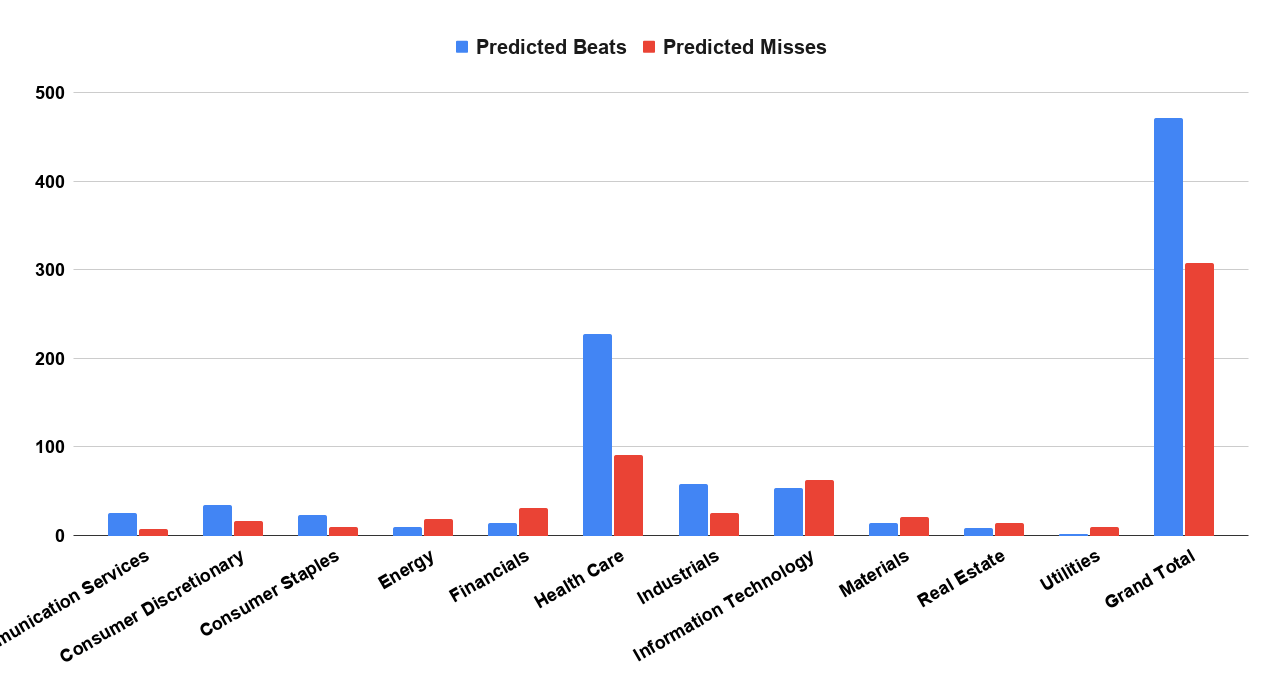
Industrials are the strongest sector in the heatmap. The sector average beat probability is 65.2%, and more than half the sector screens above the 70% threshold. The strongest signals include ESP, SPIR, VRME, ACHR, REZI, ATRO, SATL, CAE, DCO, CDRE, STN, RBC, and MHH. This is the cleanest sector-level read for beat strength.
Communication Services also screens well, with an average beat probability of 63.5%. TME, FOXA, AENT, NBIS, TGNA, VENU, and GETY help anchor the green zone. FOXA is especially relevant because it offers a more liquid, index-linked setup with ad-cycle and sports-rights read-through.
Consumer Staples is positive but bifurcated. APEI, EWCZ, LINC, IMKTA, AFYA, HIMS, REED, and DDL screen well, while NAII, BLNE, ALCO, AACG, and HAIN sit near the bottom of the sector. HIMS remains one of the more interesting narrative-heavy names because investors are watching growth, unit economics, marketing efficiency, and AI-enabled personalization.
Health Care has the largest number of reporting companies. The average probability is 54.4%, with a broad middle of the distribution. STE is the standout large-cap signal at 97.1%, while TAK, AUPH, HROW, CRMD, CPRX, RCKT, and LEGN also screen well. The risk side is concentrated in lower-probability small-cap biotech and medtech names.
Information Technology is more mixed than the AI narrative might imply. The sector average is only 50.1%, with just 4.3% of names above 70%. AMAT is the key large-cap Tech signal at 90.4%, while CSCO, STNE, DOX, GLOB, and NOVT screen positively. But the long tail of smaller hardware, software, and device names keeps the overall sector from looking uniformly strong.
Energy, Real Estate, Financials, and Utilities carry the most visible miss-risk. Energy has some strong names, including TRMD, DNN, CQP, OVV, and NINE, but the sector average is only 45.4%. Financials average 43.4%, Real Estate 46.5%, and Utilities 42.1%.
Top Beats/Misses - Week of May 11 - 17, 2026
Top 6 Beats
Ticker | Company | Announces | Sector | Market Cap | Beat Probability |
STE | STERIS plc | May 11 AMC | Health Care | Large / $22.2B | 97.1% |
ESP | Espey Mfg. & Electronics | May 11 Midday | Industrials | Small / $140M | 96.3% |
APEI | American Public Education | May 11 AMC | Consumer Staples | Small / $547M | 96.2% |
SPIR | Spire Global | May 13 AMC | Industrials | Small / $399M | 95.2% |
VRME | VerifyMe | May 12 Midday | Industrials | Small / $9M | 94.6% |
ACHR | Archer Aviation | May 11 AMC | Industrials | Mid / $8.4B | 94.4% |
Top 6 Misses
Ticker | Company | Announces | Sector | Market Cap | Beat Probability |
ASTC | Astrotech | May 12 Midday | Industrials | Small / $9M | 8.6% |
FTHM | Fathom Holdings | May 12 Midday | Real Estate | Small / $37M | 14.2% |
IPWR | Ideal Power | May 14 BMO | Industrials | Small / $52M | 16.2% |
EU | enCore Energy | May 11 Midday | Energy | Small / $840M | 17.4% |
NOA | North American Construction Group | May 13 AMC | Energy | Small / $616M | 18.7% |
CWD | Caliber Cos | May 13 AMC | Financials | Small / $4M | 21.9% |
Top Movers: Largest Score Changes Since April 30
Upward Movers
SPIR: 43.3% → 95.2% /+51.9 pts.
The largest positive reset, with the model moving sharply toward a very likely beat profile.
BWEN: 40.1% → 83.7% /+43.7 pts.
Broadwind shifted into a much more constructive Industrials setup.
BEEP: 33.9% → 77.4% /+43.4 pts.
Improvement tied to accumulated depreciation, gross profit/assets, cash/operating profit, and capitalized-expense variables.
ATRO: 51.1% → 93.5% /+42.4 pts.
A major Aerospace & Defense upgrade, supported by profitability and balance-sheet factor inputs.
EVEX: 45.3% → 84.9% /+39.6 pts.
Eve Holding moved into a stronger beat setup, helped by CFO bullishness-change, gross profit/sales, and cash/operating profit variables.
BATRA: 41.5% → 79.9% /+38.4 pts.
A notable Communication Services upgrade, tied to EBIT/sales, CFO-bullishness change, and capitalized-expense metrics.
Downward Movers
HYLN: 85.0% → 42.0% /-43.0 pts.
The sharpest downward reset, with pressure tied to CFO bullishness change, analyst bullishness change, CEO evasiveness, and sentiment variables.
ASMB: 71.5% → 30.9% /-40.6 pts.
Health Care small-cap risk increased meaningfully, with EBT/fixed assets and profitability factors weighing on the model.
AKA: 76.4% → 40.9% /-35.5 pts.
Consumer Discretionary downside move tied to inventory/current assets, CFO bullishness change, gross profit/assets, and cash/operating profit.
DC: 72.7% → 37.5% /-35.2 pts.
Materials miss risk increased, with fixed assets/capitalized expenses and current asset/capitalized expense factors contributing.
IVDA: 58.7% → 23.7% /-35.0 pts.
Industrials' small-cap score reset lower on capitalized-expense and related balance-sheet inputs.
TXMD: 64.2% → 29.4% /-34.7 pts.
Health Care risk rose into the print, with profitability and asset-efficiency variables weighing on the signal.
Earnings to Watch Beyond the Top Tables
A few names are not necessarily the highest-probability signals, but they are among the more liquid and narrative-relevant setups this week:
FOXA screens as a very likely beat at 87.7%, with index relevance and read-through to advertising, sports rights, and media margin discipline.
HIMS screens positive at 77.3%, with the market focused on DTC growth, marketing efficiency, unit economics, and whether AI-enabled personalization is improving conversion.
OVV screens at 71.4%, making it one of the more interesting Energy beat setups. The read-through is less about AI and more about whether energy can still offer cheap cash-flow growth while AI-linked equities trade at richer multiples.
AMAT screens at 90.4%, making it the most important large-cap Technology beat signal in the file. It is a direct read-through for semiconductor equipment demand, AI infrastructure capex, and whether the chip supply chain remains resilient.
CEG is the feature name because its standalone research card shows a late upgrade to 68.9%. It is not just a Utilities print. It is a test of whether AI power demand can become contracted earnings power.
Recap
The best sector signal is Industrials. The best market-cap signal is Large Cap. The most interesting feature setup is CEG, because the AI trade is broadening from chips and capex into power generation, nuclear reliability, and long-duration infrastructure demand. The highest-risk zones are in Financials, Energy, Real Estate, Utilities, Materials, and small-cap balance-sheet-sensitive names.
About the Model
Cmind AI’s EPS predictions are powered by a machine learning model built for accuracy, objectivity, transparency, and daily updates with the latest market information. We ingest over 150 variables across five data modalities—including real-time 10-Q filings, earnings transcripts, governance metrics, and peer signals—to provide early, company-specific EPS forecasts.
Our EPS signals are updated daily across 4,400+ U.S. stocks using a multi-input ML model (filings, transcripts, price-to-earnings dynamics, governance, and peer signals). The goal isn’t to predict headlines—it’s to quantify where dispersion is most likely so you can build better baskets, hedges, and sizing into catalyst windows.
📩 To learn more, contact us at [email protected].