- Cmind AI by Weihong Zhang
- Posts
- Cmind Q4 Scorecard: durable 70%+ accuracy — Small Caps, Signal Shifts, and the First AI CapEx Payback Test
Cmind Q4 Scorecard: durable 70%+ accuracy — Small Caps, Signal Shifts, and the First AI CapEx Payback Test
Industrials lead the right tail while Utilities and micro-energy reset | Top Movers driving repricing, not sectors
John DiBenedetto & Weihong Zhang
March 23, 2026
Cmind Earnings Edge — Week of March 23–28, 2026
We’re in the “post-earnings digestion” pocket: fewer mega/large-cap prints, more small/mid-cap catalysts, and a tape that’s increasingly trading reaction function over headline EPS. The data supports that setup: this week’s distribution is compressed (median ~52%), with only 9 names ≥70% beat probability but 18 names ≤30%—a risk-skewed week where left-tail gaps can dominate P&L even if the index feels quiet.
Here are two framing points:
Dispersion is the product. When the cross-section is tight but the tails are asymmetric, your edge often comes from where the tape is repricing expectations fastest (Top Movers), not from broad sector narratives.
CapEx is changing the grading rubric. March prints showed the market will still finance AI buildout when it comes with demand + margins + visibility. April is where investors start asking for payback timelines—spend alone is no longer sufficient.
Feature of the Week:
2025Q4 Earnings Scorecard & Cmind Predictor Accuracy
Across 2025Q4, Cmind’s EPS Predictor reinforced a core structural theme: accuracy is no longer just predictive—it is shaping where dispersion clusters form and how they monetize post-earnings. The quarter demonstrated that the model is not simply identifying beats and misses, but increasingly mapping where dispersion will concentrate and how it will monetize post-print.
These gains reflect continued evolution across three foundational layers of the engine:
(1) Earnings-quality signal extraction
Cmind has expanded its ability to interpret how companies generate earnings—not just whether they beat. This includes deeper parsing of:
Cash conversion (DSO, accruals, AR/revenue dynamics)
Margin-throughput relationships (pricing vs cost discipline)
Guidance clarity and forward visibility
This allows the model to differentiate between high-quality beats and low-quality beats —a key driver of post-earnings drift.
(2) Cross-factor interaction modeling
The model has strengthened its nonlinear interaction framework across:
Capital intensity (CapEx vs revenue scaling)
Balance sheet durability and funding flexibility
Product mix shifts and end-market demand
These interaction effects have materially improved sensitivity to inflection points, particularly in sectors where growth and capital deployment are tightly linked (AI, Industrials, Energy).
(3) Event-window signal prioritization
Daily re-estimation and factor decay continue to enhance responsiveness in earnings windows:
Recent estimate revisions and sentiment shifts are weighted more heavily
Stale relationships decay faster
Short-cycle signals (guidance language, bookings, backlog commentary) are prioritized
This has improved timing precision, especially in the final 10–15 trading days before a release.
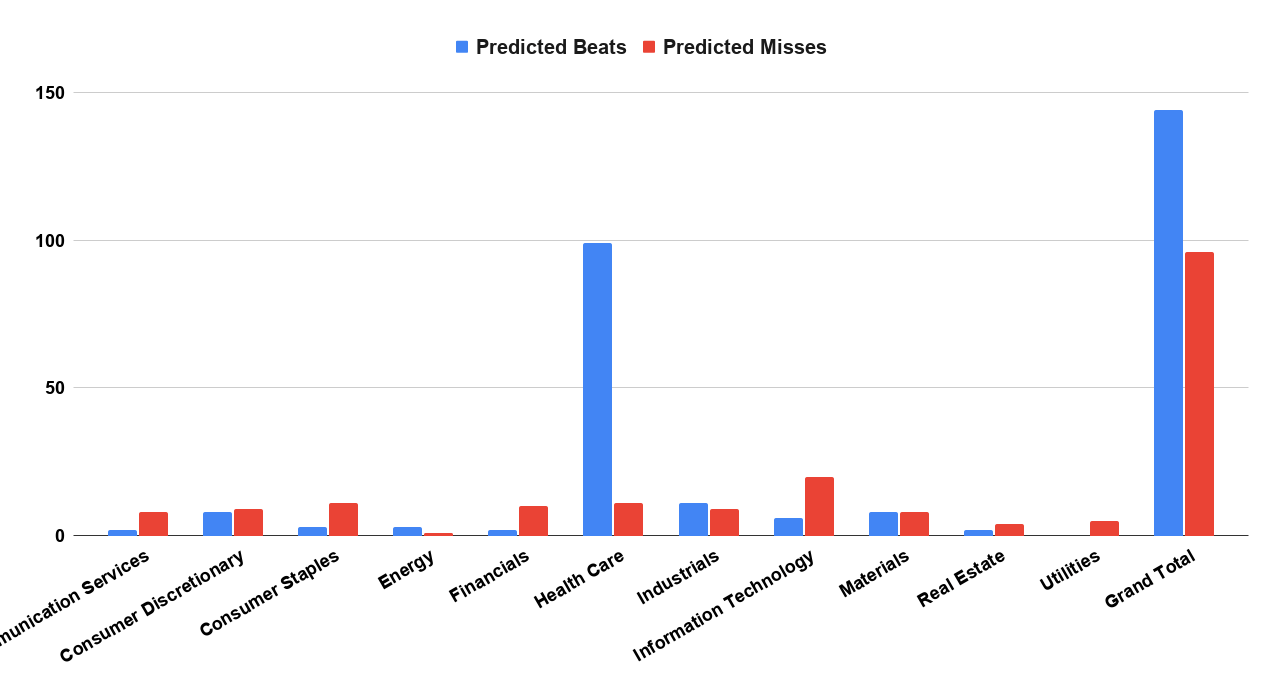
The 2025Q4 Accuracy Dataset — What Changed
The Q4 dataset (4,254 companies) highlights several structural improvements:
High-confidence bands remain durable:
Large caps (73%), mid-caps (70%), and small caps (65%) show consistent accuracy across the capitalization spectrum, with less degradation in small caps than prior cycles—a critical improvement for dispersion strategies.Sector-level stability has broadened:
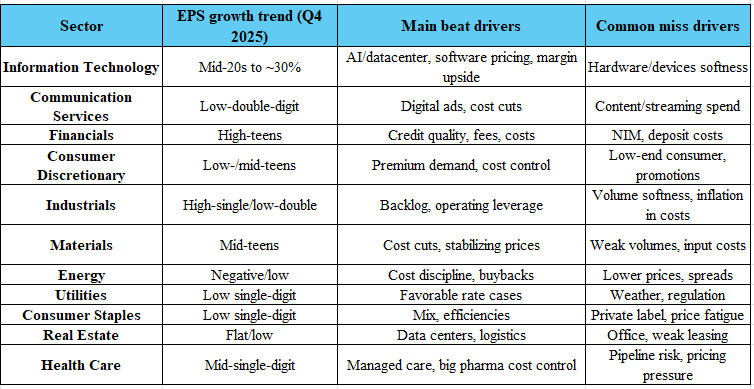
Accuracy remains strongest in:
Financials (74%)
Information Technology (72%)
Industrials (72%)
But importantly, second-tier sectors (Consumer Discretionary, Staples, Health Care) have tightened their error distributions, reducing volatility in signal quality.
Left-tail detection has improved meaningfully:
The model is increasingly effective at identifying miss-risk clusters, particularly in:Capital-intensive subsectors
Consumer-facing names with margin compression
Lower-visibility guidance profiles
This strengthens the short basket, where avoiding false positives is as valuable as identifying winners.
Error magnitude compression:
The model is reducing “wrong-sign” errors—cases where fundamentals deteriorate despite positive expectations. These are typically the most damaging for long/short portfolios, and their decline materially improves risk-adjusted returns.
Why This Matters
We are operating in a dispersion-first tape, where:
Index direction is less predictive
Sector beta is less reliable
Stock-level execution drives returns
In this environment, accuracy at the tails (top and bottom deciles) becomes the dominant source of alpha.
Cmind’s improved clustering allows PMs to:
Build beta-neutral alpha portfolios with tighter dispersion capture
Construct pairs and relative-value trades with clearer asymmetry
Size positions more precisely into catalyst windows, based on signal strength
Notably, Q4 reinforced that correct calls are increasingly followed by cleaner post-earnings drift, particularly when:
Guidance is aligned with the signal
Earnings quality confirms the beat/miss
Macro noise is secondary to company-specific execution
The Bigger Picture — From Prediction to Portfolio Construction
The most important evolution is not just higher accuracy—it is the model’s ability to identify structural clusters that repeat across quarters.
In 2025Q4, several patterns emerged:
Industrials and execution-driven cyclicals
Backlog visibility + operating leverage → consistent beat clustersPlatform Tech and AI-linked infrastructure
Strong demand + pricing power → durable right-tail signalsConsumer and long-tail discretionary/software
Margin pressure + demand variability → increasing left-tail densityCapital-intensive subsectors
Higher dispersion tied to CapEx efficiency and return visibility
These clusters are not one-off—they are repeatable frameworks that inform both:
Pre-earnings positioning
Post-earnings drift capture
Forward Setup — Why This Quarter Is Different
The transition from Q4 into Q1/Q2 2026 introduces a new variable:
the market is shifting from “earnings delivery” to “capital efficiency.”
This is where the accuracy improvements matter most.
As AI CapEx, infrastructure spend, and margin scrutiny increase, the market will:
Reward earnings + efficiency
Penalize earnings without clarity
Cmind’s ability to:
Detect quality of earnings,
Weight forward-looking signals, and
Identify cluster formation early
positions it not just as a forecasting tool—but as a portfolio construction engine in a dispersion-dominated regime.
AI CapEx: April is the first real “payback audit”
The market is transitioning from “AI spend is bullish” to *“AI spend is bullish only if monetization is measurable.” April earnings are shaping up as the first meaningful stress test of that trade: investors will pressure management teams to translate CapEx into revenue per dollar invested, margin expansion, and durable operating leverage—not just bigger budgets.
A clean way to think about it is a 3-bucket framework (useful for baskets/pairs):
Buildout enablers where CapEx is still a positive signal because it’s tightly demand-linked (utilization/backlog/shipments are visible).
Efficiency dividend names where AI is showing up as productivity + margin (proof of ROI).
Spend-without-payback names where CapEx risks becoming a drag (vague ROI, widening guide bands).
What to listen for:
Payback timelines: do they quantify returns or widen the range?
Utilization + backlog quality: do they describe demand as durable or “lumpy”?
Margin-throughput language: do they connect AI growth to unit economics?
Tone shift: any move from “investment phase” to “harvest phase” tends to compress dispersion.
Bottom line: April is likely a dispersion accelerator across AI-adjacent subsectors. If you trade earnings reactions systematically, treat CapEx commentary as a primary driver of post-print drift, not a footnote.
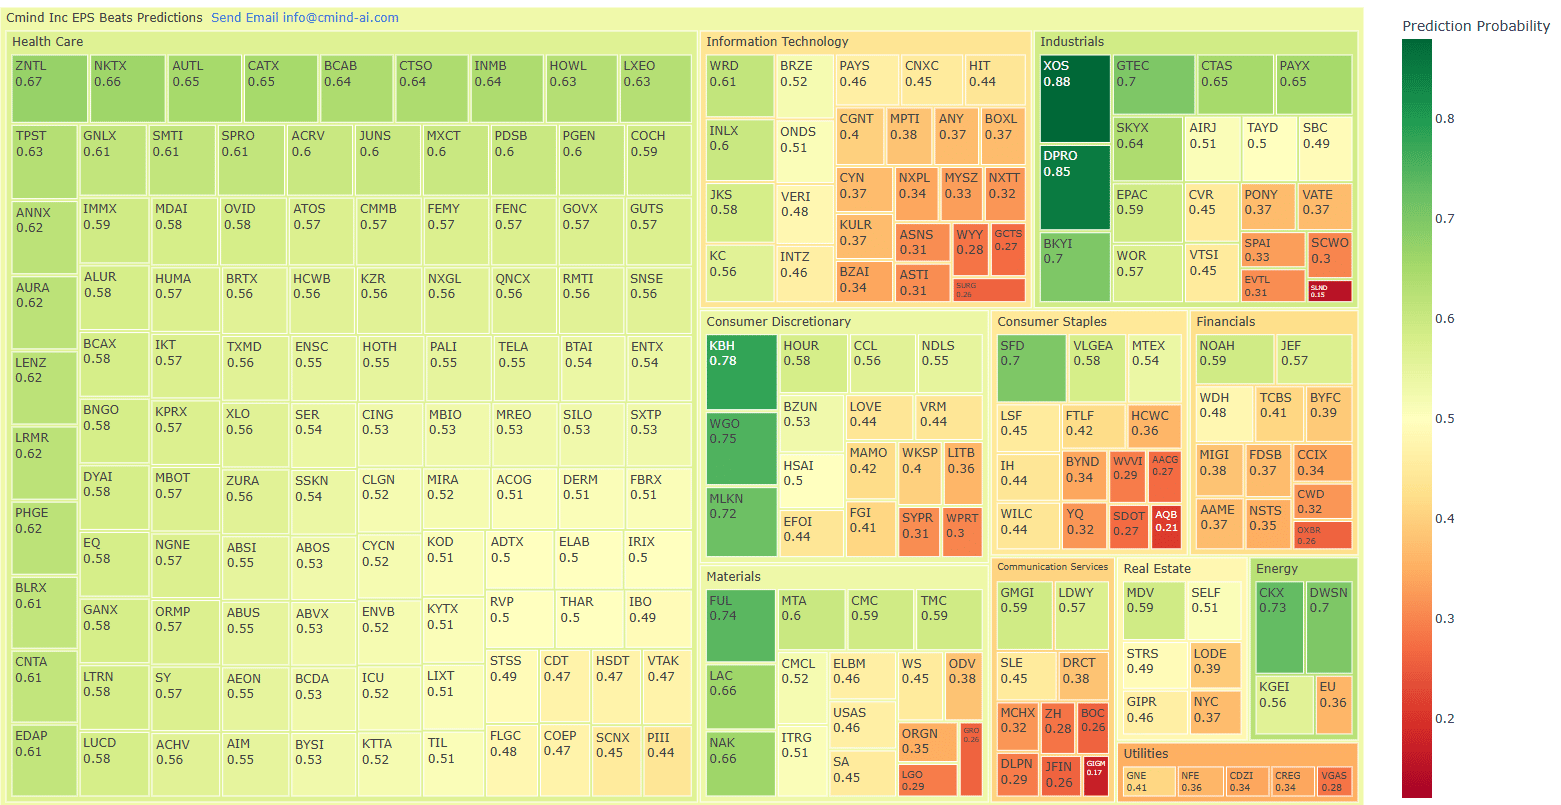
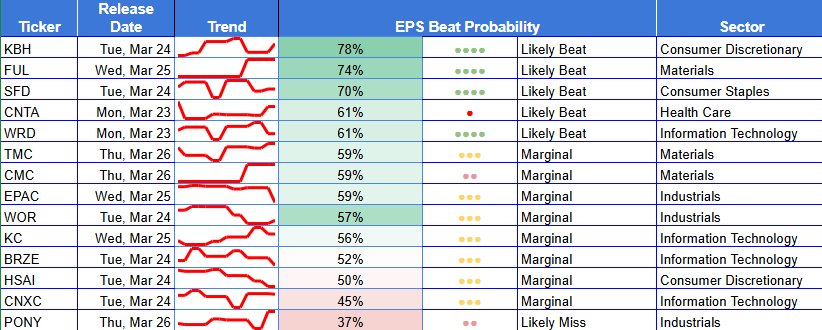
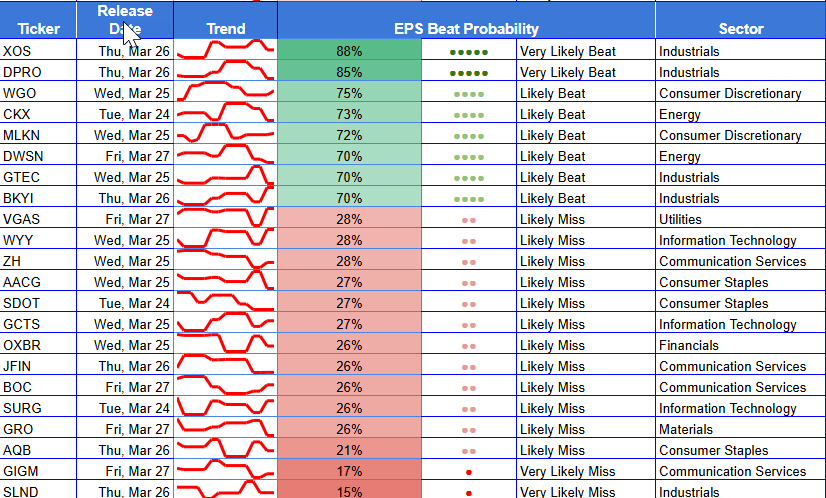
Top Beats / Misses for Week of March 23, 2026
Top 6 Beats
XOS — 88% (Industrials, Small)
DPRO — 85% (Industrials, Small)
KBH — 78% (Consumer Discretionary, Mid)
WGO — 75% (Consumer Discretionary, Mid)
FUL — 74% (Materials, Mid)
CKX — 73% (Energy, Small)
Top 6 Misses
BZAI — 28% (Information Technology, Small)
SDOT — 27% (Consumer Staples, Small)
AACG — 27% (Consumer Staples, Small)
OXBR — 26% (Financials, Small)
SCWO — 26% (Industrials, Small)
GPRO — 26% (Materials, Small)
Heatmap
Heatmap — Market Cap exposure
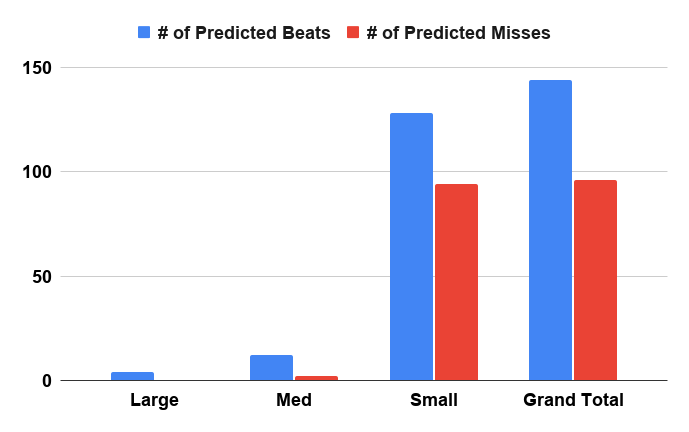
This is a small-cap microstructure week. The dataset is overwhelmingly Small-cap, with a lighter Mid-cap sleeve and minimal Large-cap presence. Net: expect wider post-print ranges, more liquidity-driven gaps, and faster mean-reversion vs trend depending on how clean the guide is.
Large Cap
Large cap: limited names → fewer “index-level” impulses; reactions may express via sector ETFs less, single-names more.
Mid Cap
Mid cap: where the “execution premium” can still show up cleanly (e.g., housing/materials-related midcaps).
Small Cap
Small cap: where the left tail matters most—guidance ambiguity + thin liquidity can dominate.
Heatmap — Sector exposure
Industrials = the clearest right tail and the clearest gap-risk. You have the highest-probability names (XOS, DPRO) and meaningful left-tail pockets (e.g., SCWO). That’s a classic “same-sector, different distributions” week—good for relative value and pairs framing.
Consumer Discretionary = selective strength. KBH and WGO sit on the right tail, while other discretionary names cluster closer to neutral—suggesting idiosyncratic underwriting (company-level execution) rather than a broad consumer beta call.
Health Care = broad neutral density. A lot of names, but mostly mid-band probabilities—less about “big beats,” more about dispersion inside the band (the tape will trade guide language + pipeline/coverage tone).
Tech/Comm/Utilities = heavier left-tail pockets. This is where your risk hedges live this week: more names screening ≤30% implies fragility flags where one line of guidance can dominate the quarter.
Top Movers (±10 pts)
These are expectation shifts, not price moves — where the market is repricing fastest.
✅ Upward shifts
Ticker | p15 → Now | Δ (pts) | Sector | Cap |
DPRO | 30% → 85% | +55 | Industrials | Small |
DWSN | 31% → 70% | +39 | Energy | Small |
CKX | 40% → 73% | +33 | Energy | Small |
ODV | 5% → 38% | +33 | Materials | Small |
XOS | 63% → 88% | +25 | Industrials | Small |
LAC | 42% → 66% | +24 | Materials | Small |
VRM | 23% → 44% | +21 | Consumer Discretionary | Small |
ELBM | 27% → 46% | +19 | Materials | Small |
KGEI | 37% → 56% | +19 | Energy | Small |
TMC | 41% → 59% | +18 | Materials | Small |
LOPE | 64% → 77% | +13 | Consumer Staples | Small |
NOAH | 47% → 59% | +12 | Financials | Small |
⚠️ Downward shifts
Ticker | p15 → Now | Δ (pts) | Sector | Cap |
NFE | 65% → 36% | -29 | Utilities | Small |
GNE | 62% → 41% | -21 | Utilities | Small |
EU | 55% → 36% | -19 | Energy | Small |
ZH | 44% → 28% | -16 | Communication Services | Small |
ORG | 49% → 35% | -14 | Materials | Small |
CYN | 49% → 37% | -12 | Information Technology | Small |
MCHX | 44% → 32% | -12 | Communication Services | Small |
DLPN | 41% → 29% | -12 | Utilities | Small |
LGO | 41% → 29% | -12 | Materials | Small |
SDOT | 39% → 27% | -12 | Consumer Staples | Small |
CWD | 46% → 34% | -12 | Financials | Small |
AMPY | 47% → 35% | -12 | Energy | Small |
Commentary:
This week’s mover tape is small-cap and asymmetric: the biggest upward flips are concentrated in Industrials/Energy/Materials (DPRO, DWSN, CKX, XOS, LAC), while the sharpest resets sit in Utilities and micro energy (NFE, GNE, EU). That’s a classic “dispersion regime” where the market is selectively underwriting execution in a few right-tail names while marking down fragility where guidance visibility is low.
Two practical reads:
Confidence ramps (big up + now ≥70%) often reflect late-window convergence—distribution tightening into the print.
Fragility flags (big down + now ≤40%) are where one line of guide can dominate the EPS optics, especially in thin liquidity.
Setup for next week
Next week will start to shift attention from “Q4 wrap” to Q2/Q3 visibility—especially around AI spend payback language as we move toward April’s CapEx audit. Expect more debate on margin-throughput (what spend buys), not just spend size. Keep watching whether right-tail names hold their probability into the event window; any late fades tend to be the first tell that the guide risk is widening.
About the Model
Cmind AI’s EPS predictions are powered by a machine learning model built for accuracy, objectivity, transparency, and daily updates with the latest market information. We ingest over 150 variables across five data modalities—including real-time 10-Q filings, earnings transcripts, governance metrics, and peer signals—to provide early, company-specific EPS forecasts.
Our EPS signals update daily across 4,400+ U.S. stocks using a multi-input ML model (filings, transcripts, price/earnings dynamics, governance, and peer signals). The goal isn’t to predict headlines—it’s to quantify where dispersion is most likely so you can build better baskets, hedges, and sizing into catalyst windows.
📩 To learn more, contact us at [email protected].