- Cmind AI by Weihong Zhang
- Posts
- Cmind's Edge: Dispersion Week - Trade the Spread, Not Beta
Cmind's Edge: Dispersion Week - Trade the Spread, Not Beta
Mega-cap cluster and GDP/PCE; expecting a correlation wobble—greater focus on single-name vs index exposure.
John DiBenedetto & Weihong Zhang
October 27, 2025
Week of October 27, 2025
Hi everyone!
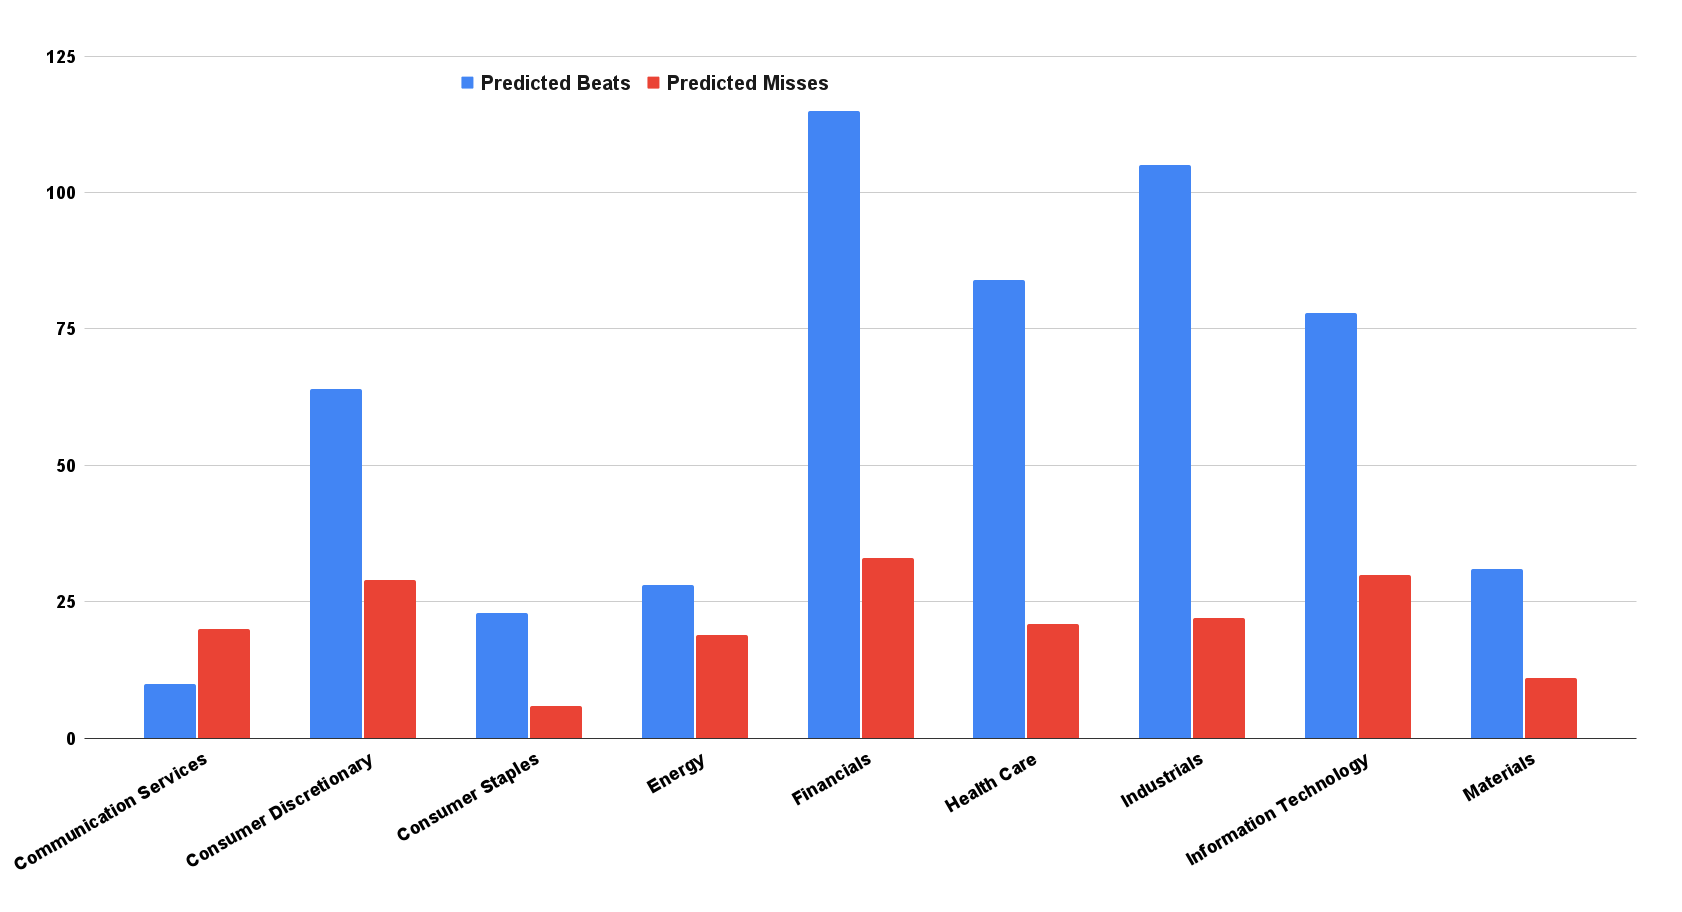
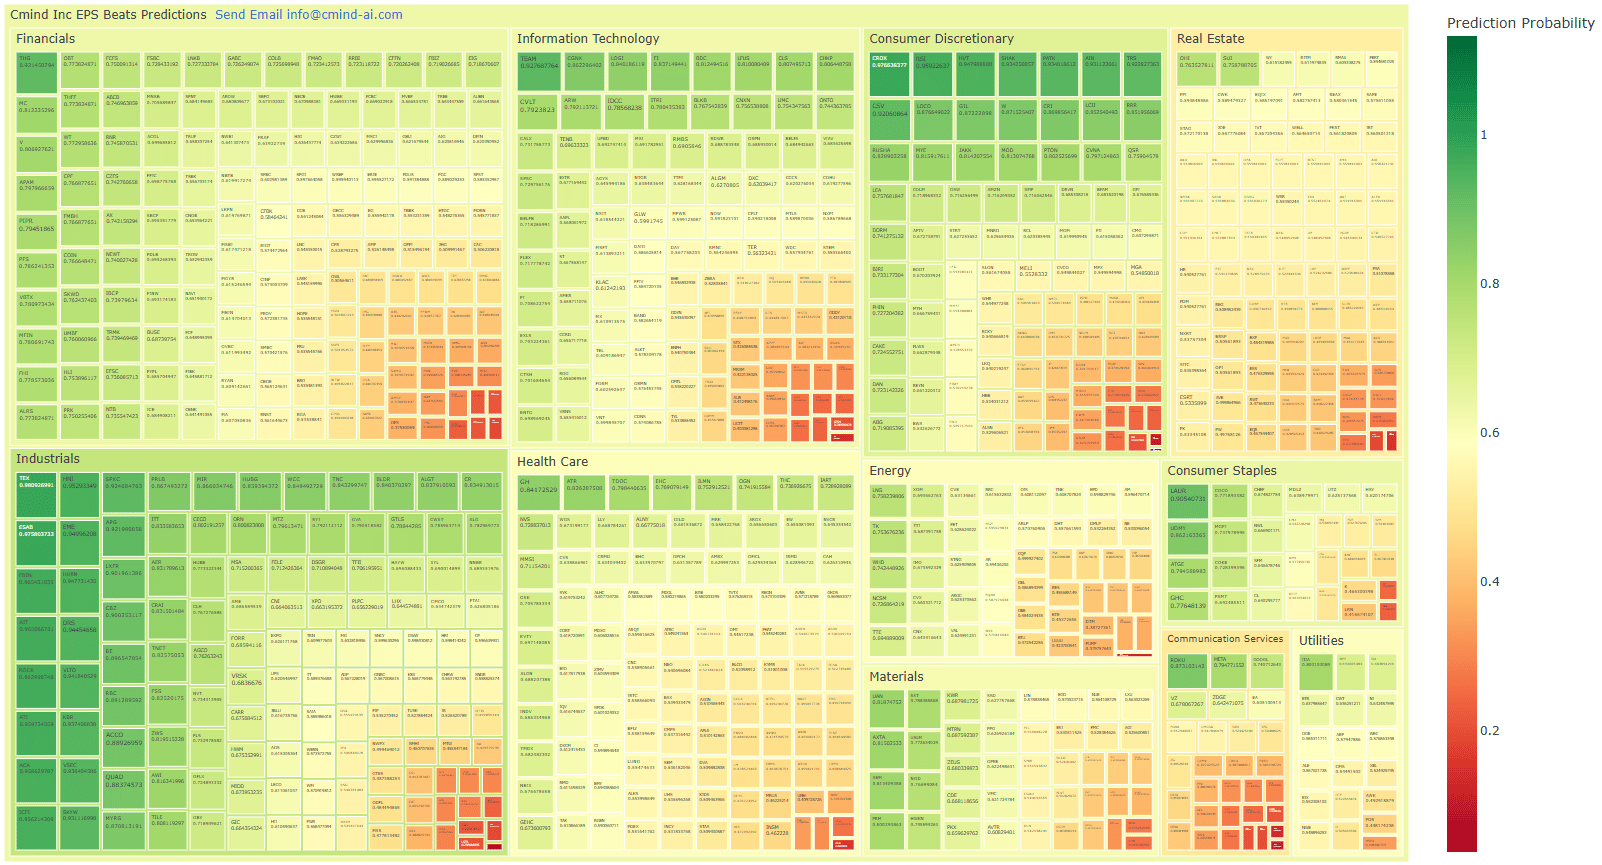
This week’s heatmap doesn’t argue for a market call; it argues for a stock-selection call. The pattern is unmistakable: broad, contiguous greens across Industrials and Utilities; healthy pockets in Materials; a barbell inside Financials; and a two-tone Technology block where platform leaders screen constructive while the long tail slips orange to red.
That is the textbook setup for dispersion—own the names, neutralize the index, and let guidance do the separating.
[Read the complete outlook and predictions for all companies releasing this week]
The forward setup writes itself from the same map. Industrials/Utilities can remain your carry engines into November as backlog and rate stability keep the drift alive. Materials provide a relative-value ladder if restock commentary firms. Financials’ barbell extends into holiday credit—majors and insurers compound steady beats while subprime and BNPL names grapple with provisions and re-aging math. Technology stays two trades: platforms tethered to AI/ads/cloud keep optionality, while the long tail remains a source of funded shorts and defined-risk fades. Real Estate is a rates spread, not a sector bet, and small-cap Health Care is more catalyst calendar than earnings season—treat it as such.
Bottom line: this is a dispersion tape. Neutralize beta, press spreads where the gradients are sharpest (Tech long-tail, REIT split, Financials barbell), and let the heatmap guide which names you carry beyond the headline. Into next week—and into Q4—the same playbook should compound: trade the spread, not the story.
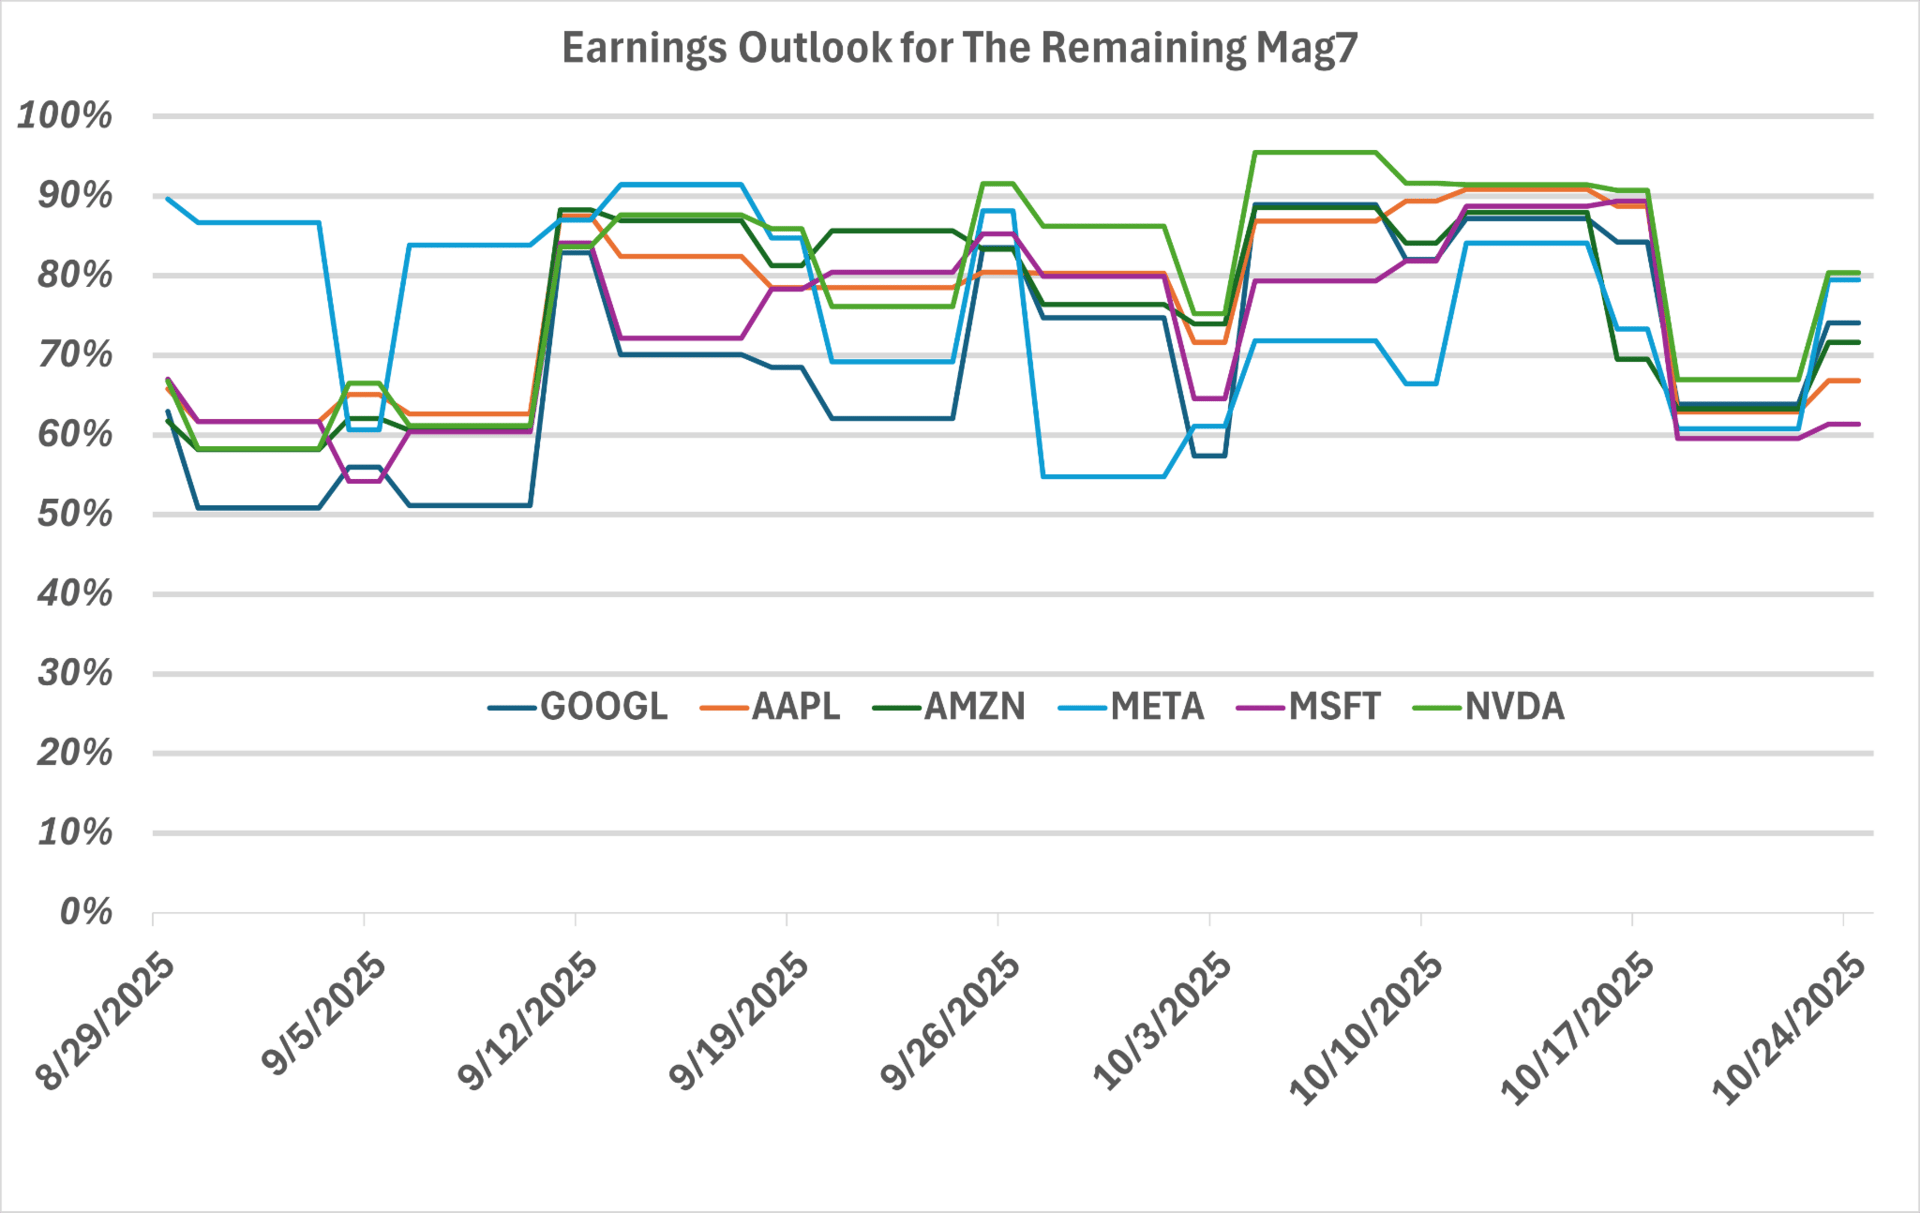
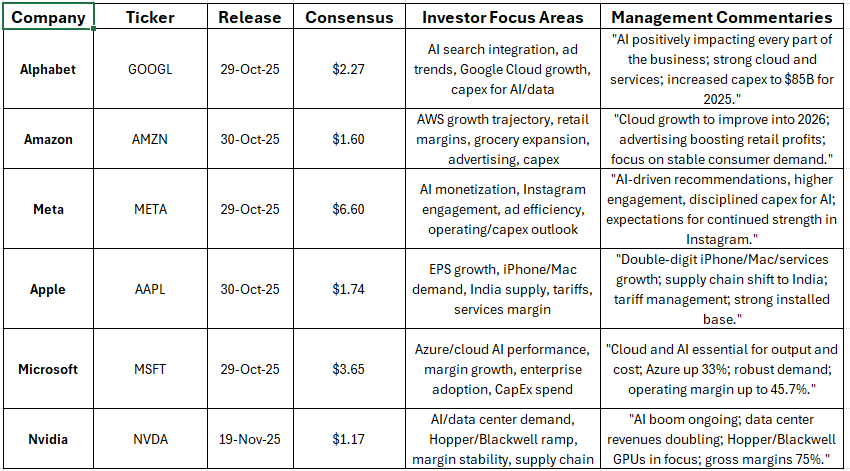
Stock Analysis: Mag 7
Among the Magnificent 7 companies, TSLA released its earnings last week. This week will see the earnings releases of GOOGL, AMZN, META, AAPL, and MSFT, except that NVDA is scheduled to mid-November.
Magnificent 7 earnings releases are important because they have an outsized influence on headline index performance, investor sentiment, and sector trends due to their dominant weight in the S&P 500 and their role as drivers of innovation, earnings growth, and market leadership.
Our daily updated predictions show that they are likely to be strong beats over the past two months, though their beat probabilities have been down-revised in the past couple of days.
Industrials read like an execution tape: pricing/mix and backlog visibility light up multiple sub-buckets—machinery, transports, services—less a story of one hero print and more of steady post-call drift. Materials show selective strength where specialty and industrial chemicals sit, while more commodity-linked names lag; it’s a pairs market there—long the higher-ROIC nodes, short the volume-sensitive peers—rolled forward if inventory commentary tilts to restock into November.
Financials are a barbell. Core banks and insurers trend green while a compact red cluster builds in consumer credit and alt-finance. That split is the trade: keep upside optionality in quality lenders/insurers, but express skepticism in the red pocket. The heatmap is essentially telegraphing the holiday credit debate—re-aging, roll rates, and charge-offs—so the follow-through into next week’s commentary could extend the spread.
Technology is where correlation goes to die. Platform names tied to cloud/AI/ads lean green, but the long tail—peripherals, some analog, and smaller software—skews orange/red. Avoid naked downside catching in the red tail; if you must fade, do it with broken-wing structures or defined-risk verticals.
Communication Services rhymes with Tech: platforms look fine, smaller media does not—again, a dispersion canvas rather than a blanket bet.
Across caps, this week is still a dispersion tape. In large caps, the center of gravity sits with “execution compounds” and platform businesses: companies with visible backlogs, price/mix discipline, or network effects tied to cloud/AI and payments. Those models tend to convert guidance into steady post-call drift rather than one-off pops, making them ideal for single-name over index. On the other side are rate-sensitive real estate operators, commodity/chemicals names with wobbly pass-through, and a handful of consumer and long-tail tech stories where traffic, engagement, or pricing power look uneven. The practical takeaway: let mega-cap platforms and industrial operators be your long-vol and express skepticism in the rate/commodity/long-tail pockets.
Mid caps carry the densest alpha this week, especially across industrials and services tied to projects, aero/defense, testing, and distribution. The common thread among likely winners is simple: order books that are converting, cleaner supply chains, and cost programs that protect margins—conditions that usually produce a second leg of performance after the headline. Select mid-cap tech names also screen well where product cycles tap into automation or subscription durability, while the weaker cohort tends to be channel-dependent, balance-sheet-tight, or hostage to a single product cycle. Consumer is barbelled: quality operators with inventory discipline and pricing look constructive; levered or promotion-heavy models do not.
Small caps show the widest tails—more idiosyncratic winners and more outright landmines. The model favors niche industrials and select consumer operators where inventory control and operating leverage can still show through, plus a broad swath of community and specialty finance names benefiting from earlier-cycle provisioning and steadier deposits. Tech requires selectivity: specialty components and certain workflow software look sturdier, while the long red tail in media/telecom and speculative hardware/software remains a trap for dip-buyers.
Looking ahead, the same drivers likely extend into early Q4: holiday credit will keep the financials barbell in play; AI/cloud attach and ad efficiency will sustain tech’s two-tone; and any stabilization in rates/FX should support utilities and industrial carry.
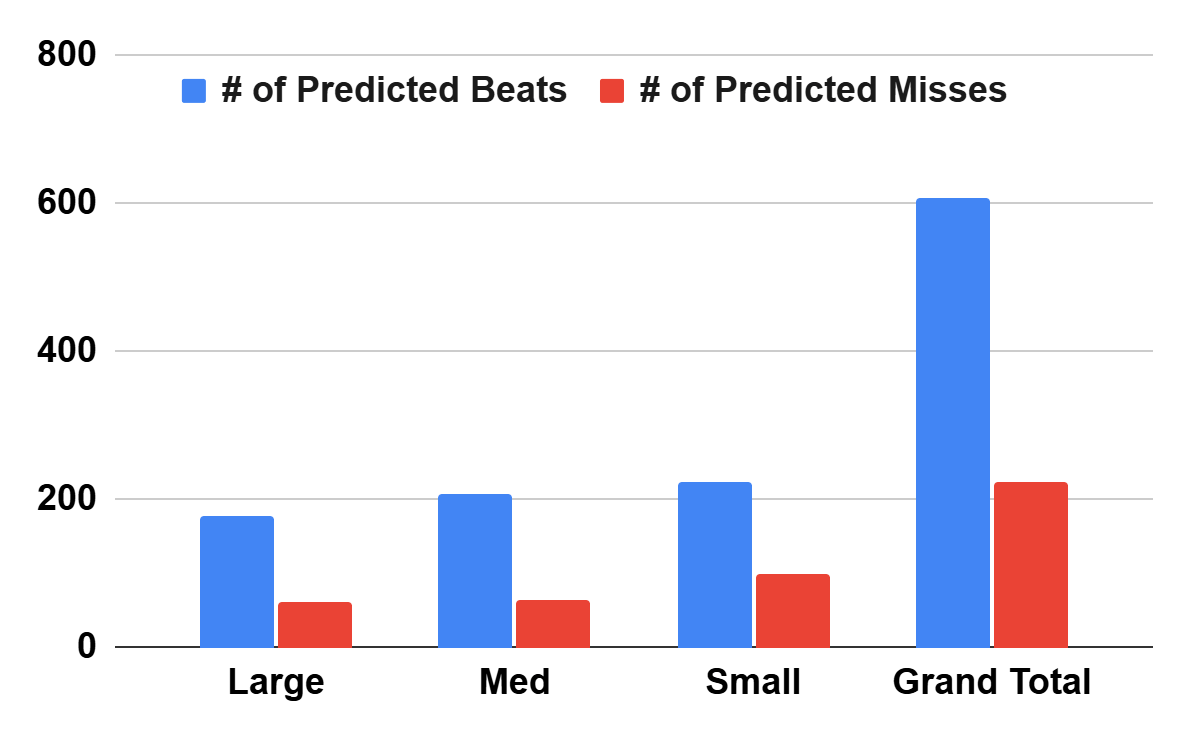
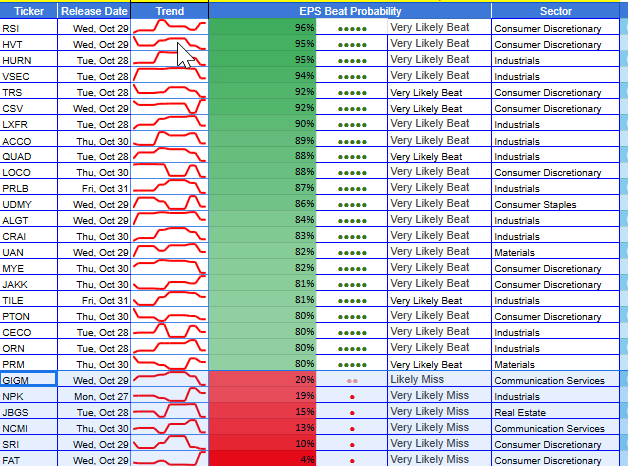
🔝 Top 5 Predicted Beats This Week
TEX (Oct 30) – 98% – Industrials – Mid Cap
CROX (Oct 30) – 98% – Consumer Discretionary – Mid Cap
ESAB (Oct 29) - 98% - Industrials - Mid Cap
FBIN (Oct 30) – 97% – Industrials – Large Cap
AIT (Oct 28) - 97 - Industrials - Mid Cap
🔻Top 5 Predicted Misses This Week
FAT (Oct 29) – 4% – Consumer Discretionary – Small Cap
TKR (Oct 29) – 8% – Industrials – Mid Cap
SRI (Oct 29) – 11% – Consumer Discretionary – Small Cap
FYBR (Oct 28) - 11% - Communication Services - Mid Cap
NOV (Oct 28) – 11% – Energy – Mid Cap
(As of October 26, 2025)
The map skews dispersion, not direction. You’ve got contiguous green in Industrials/Utilities (broad execution, stable guides), select green pockets in Materials and quality Discretionary, and a two-tone Technology block: platform leaders look resilient while the long tail trends orange/red. Financials show a barbell (majors/insurers are firm, consumer credit is soft). Real Estate is split: logistics/residential acceptable with office a landmine. Health Care is a mosaic—tools/devices steadier than small-cap biotech.
Next Week & Q4 Setup
The heatmap is broadcasting where to be selective. Carry the green: Keep post-print rolls in Industrials/Utilities where beats turn into 2–3 week drift. Maintain single-name vs. index in Tech—platform leaders vs. long-tail laggards—into early-Q4 AI/PC/mobile updates. We expect Financials spread to widen as holiday guidance lands; quality lenders/insurers > subprime/alt-finance.
Individual Stock Predictions
Large Caps
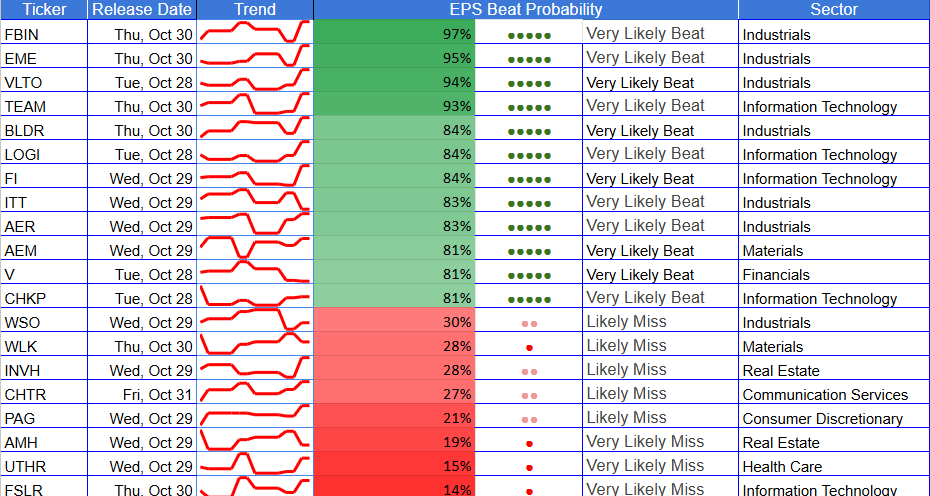
The large-cap tape is classic dispersion: platforms and “execution compounds” lean green while rate-sensitive real estate, commodity chemicals, and a few consumer names screen weak. On the high side, the model clusters very likely beats around execution-heavy stories such as TEAM (93%), VLTO (94%), EME (95%), FBIN (97%), and industrial operators AER / ITT / BLDR (83–84%). These names share two traits: backlog and pricing visibility, or subscription/transaction models where mix upgrades carry through the P&L.
On the low side, the miss cluster sits in rate- and commodity-exposed spots plus a few idiosyncratic consumer stories: FSLR (14%) and WLK (28%) flag margin pressure from ASP/feedstock dynamics; UTHR (15%) reflects drug-pricing/trial timing risk; real-estate operators such as AMH / INVH / WPC / VICI / CSGP (19–32%) remain hostage to financing costs and leasing cadence. Netting it out: for large caps, run single-name over index.
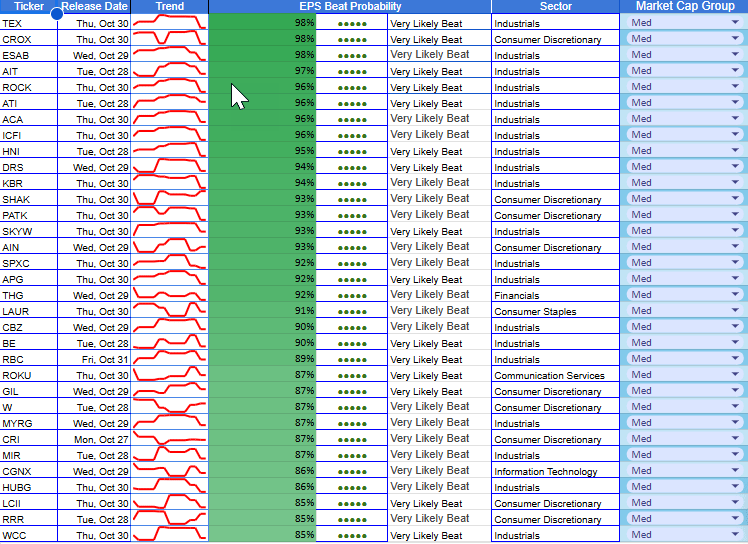
Mid Caps
Mid-cap signal density is the highest this week, especially in Industrials. The model lights up a broad swath of execution stories: ESAB / TEX (98%), AIT (97%), ATI / ACA / ICFI / ROCK (96%), KBR / DRS (94%), HNI (95%), SKYW (93%), SPXC (92%), WCC (85%), RBC (89%), CBZ / BE (≈90%), and a long tail of 70–80% names across project services, aero/defense, test & measurement, and distribution.
Tech inside mid-caps is selectively strong where product cycles attach to AI/automation or subscription durability—CGNX (86%), CLS / LFUS / BDC (81%)—while the weak tail shows up in levered or channel-dependent names like WOLF (25%), FYBR (11%), LBTYA (25%).
Consumer is bifurcated: high-probability beats in CROX (98%), W (87%), SHAK / PATK / AIN (93%), RRR (85%), CRI (87%), with misses concentrated in DFH (40%), EAT (27%), CZR (24%), HGV (25%). Energy and materials tilt constructive where supply chains and pricing are rational (VAL 62%, RRC / CNX 62–64%, AXTA 82%, SXT 79%). The clean very-likely miss tell is TKR (8%) and LSTR / CAR (21–22%).

Small Caps
Small-cap outcomes are the widest—more “lottery tickets,” but also some of the clearest signals on both tails. On the high side, the model favors industrial executors and niche consumer: VSEC (94%), PRLB (87%), QUAD (88%), ORN (80%), LXFR (90%), TILE (81%), ACCO (89%) and a wave of restaurant/retail names—LOCO (88%), CSV (92%), TRS (92%), RSI (96%), HVT (95%)—where inventory discipline, pricing, and operating leverage do the work. Small-cap Financials are broadly constructive on earlier-cycle provisioning and deposit stability—PFS (79%), CPF / VBTX / FMBH (77–78%), with many in the 60s/low-70s. Media/telecom is the weakest cohort: NCMI (13%), THRY / SHEN (≤27%), FVRR / GCI / LUMN / MAX (30–40%) all flag demand and balance-sheet friction.