- Cmind AI by Weihong Zhang
- Posts
- This Week’s EPS Watchlist: 353 Signals | AI-Led Beats | GOOGL > TSLA | OXLC & KARO Stand Out
This Week’s EPS Watchlist: 353 Signals | AI-Led Beats | GOOGL > TSLA | OXLC & KARO Stand Out
EPS Predictions for the Week of July 21st, 2025
Weihong Zhang
July 21, 2025
353 Companies Covered | GOOGL, TSLA Report This Week | NVDA, MSFT Beat Probabilities
Hi everyone,
It’s a marquee week for Big Tech earnings, and the market narrative is unmistakably dominated by one theme: AI monetization.
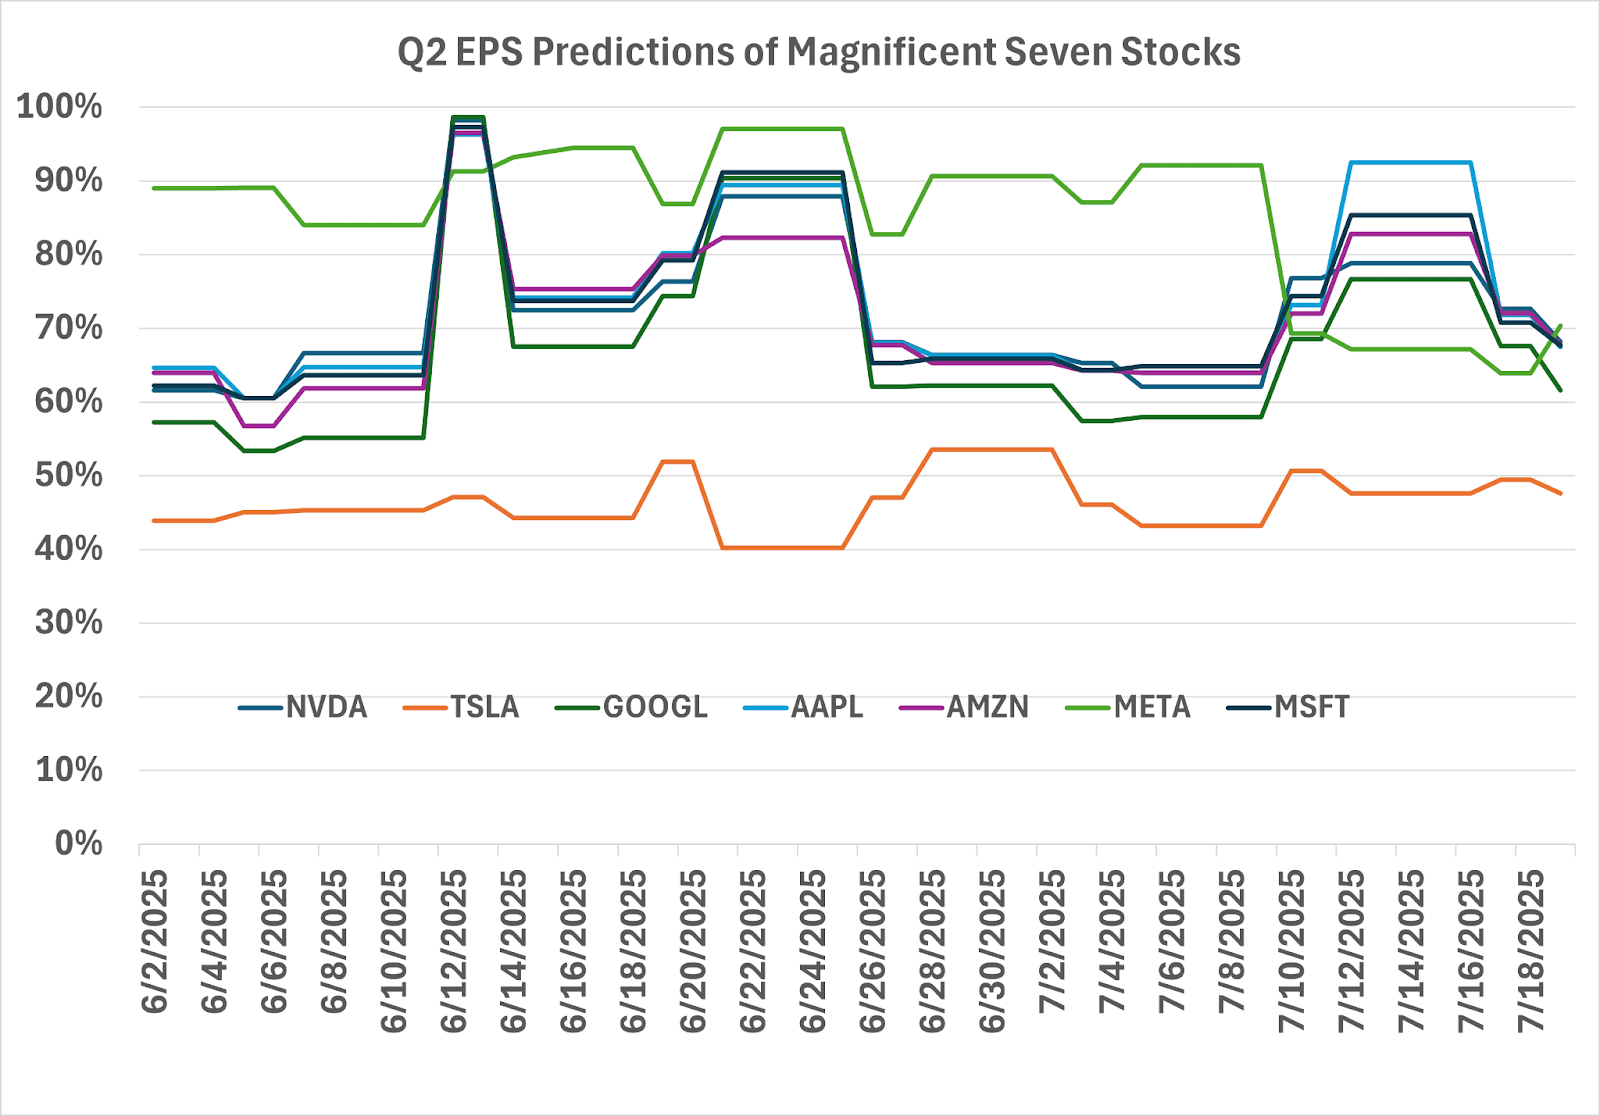
As the Magnificent Seven begin to report, our model is registering high-confidence EPS beats across most of the group, led by Nvidia, Microsoft, and Apple. Two of the seven—Alphabet (GOOGL) and Tesla (TSLA)—report this week, and we’ll be watching them closely.
Tesla stands apart as the only Mag 7 name flashing a potential miss, amid well-documented delivery and margin pressures.
The table below summarizes the full group:
Ticker | Company | EPS Beat Probability | Reporting Date |
NVDA | Nvidia | 98% | Aug 27 |
MSFT | Microsoft | 91% | Jul 30 |
AAPL | Apple | 89% | Jul 31 |
AMZN | Amazon | 85% | Jul 31 |
META | Meta | 84% | Jul 31 |
GOOGL | Alphabet | 73% | Jul 23 |
TSLA | Tesla | 49% | Jul 24 |
The Magnificent 7 Are Coming
Alphabet (GOOGL) – July 23
Strong ad revenue likely, though AI-native search formats could cannibalize click-based monetization.Tesla (TSLA) – July 24
Margin pressure from price cuts and delivery softness keep our model cautious.Microsoft (MSFT) – July 30
Azure momentum and Copilot adoption continue to drive model confidence.Meta, Amazon, Apple – July 31
All are trending toward high-probability beats. Investor focus will be on AI monetization signals and operating leverage.Nvidia (NVDA) – August 27
No earnings this week, but our model’s 98% beat prediction reflects persistent AI chip dominance.
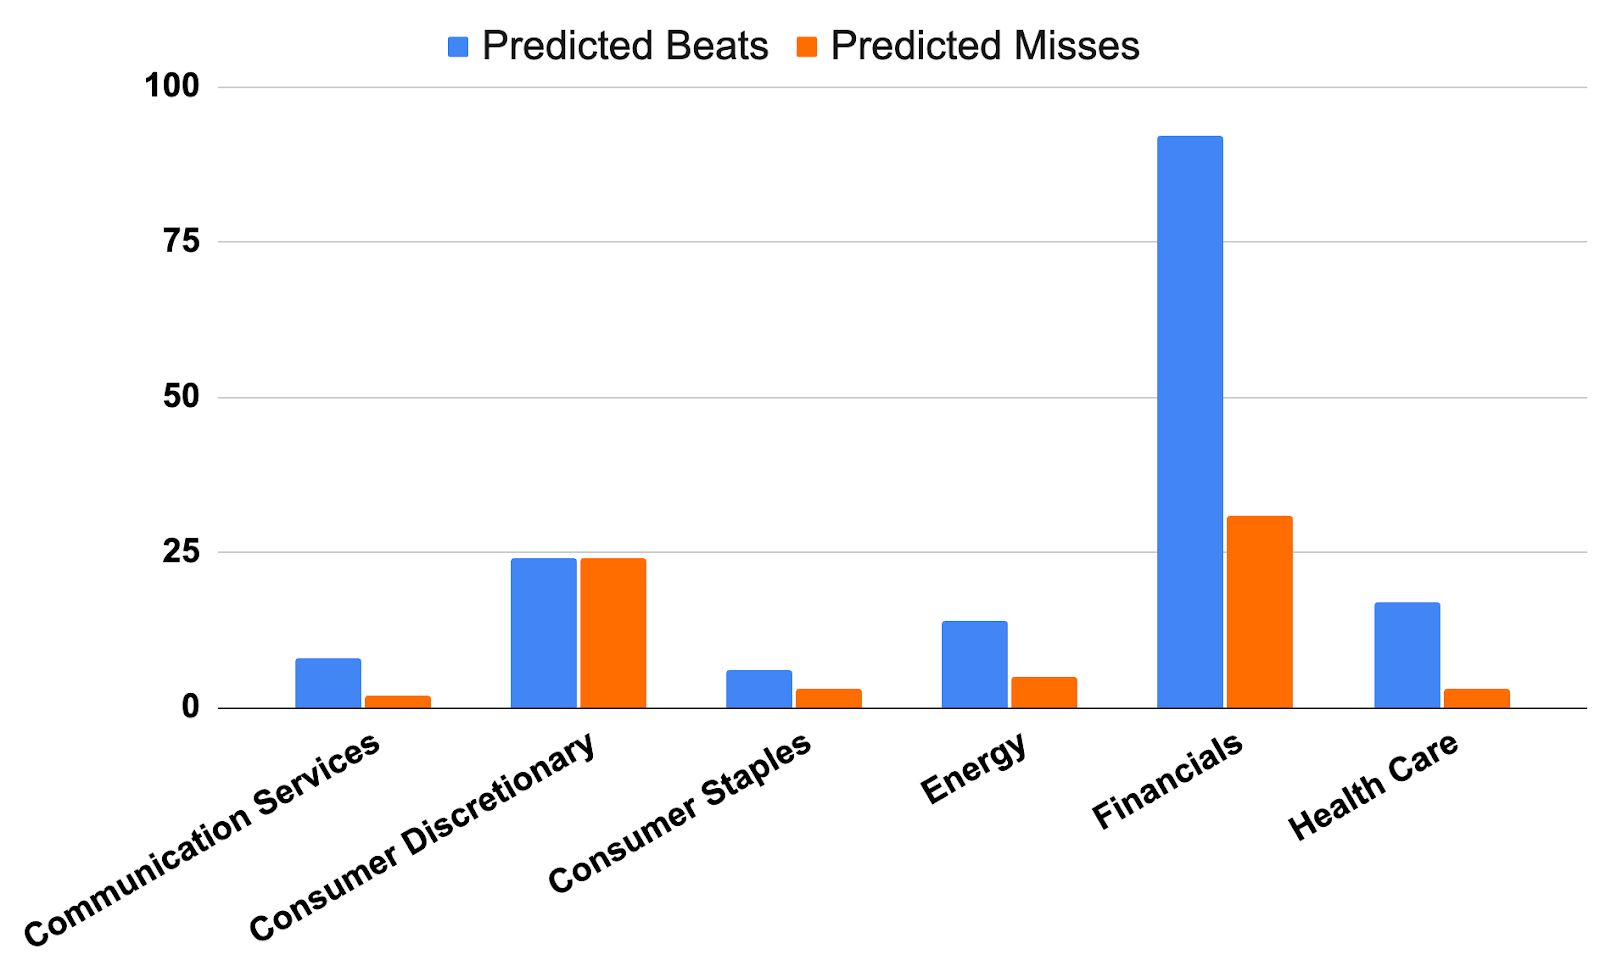
Sector Breakdown
Financials continue to dominate in both volume and beat probability, with a strong skew toward likely outperformance. The sector shows a healthy spread of predicted beats across regional banks and specialty finance. Information Technology also stands out, driven by high-probability calls in software, semis, and communications infrastructure, led by names like FI (98%), CALX (96%), and FLEX (96%).
Meanwhile, Consumer Discretionary is split: high-variance signals point to both upside (TPH, TMHC) and significant downside risk (BBWI, AN, ORLY). Health Care, Energy, and Real Estate each post selective pockets of strength, though with more balanced probabilities overall.
Market Cap Breakdown
Predicted beats are relatively strong across the board:
Large Caps show the highest beat concentration, with 95 beat calls vs 33 misses. High-confidence names like FI (98%) and KARO (93%) bolster the cohort.
Mid Caps maintain solid upside bias with 72 predicted beats and 40 misses.
Small Caps, as usual, show more dispersion, but still lean bullish: 77 predicted beats vs 36 misses.
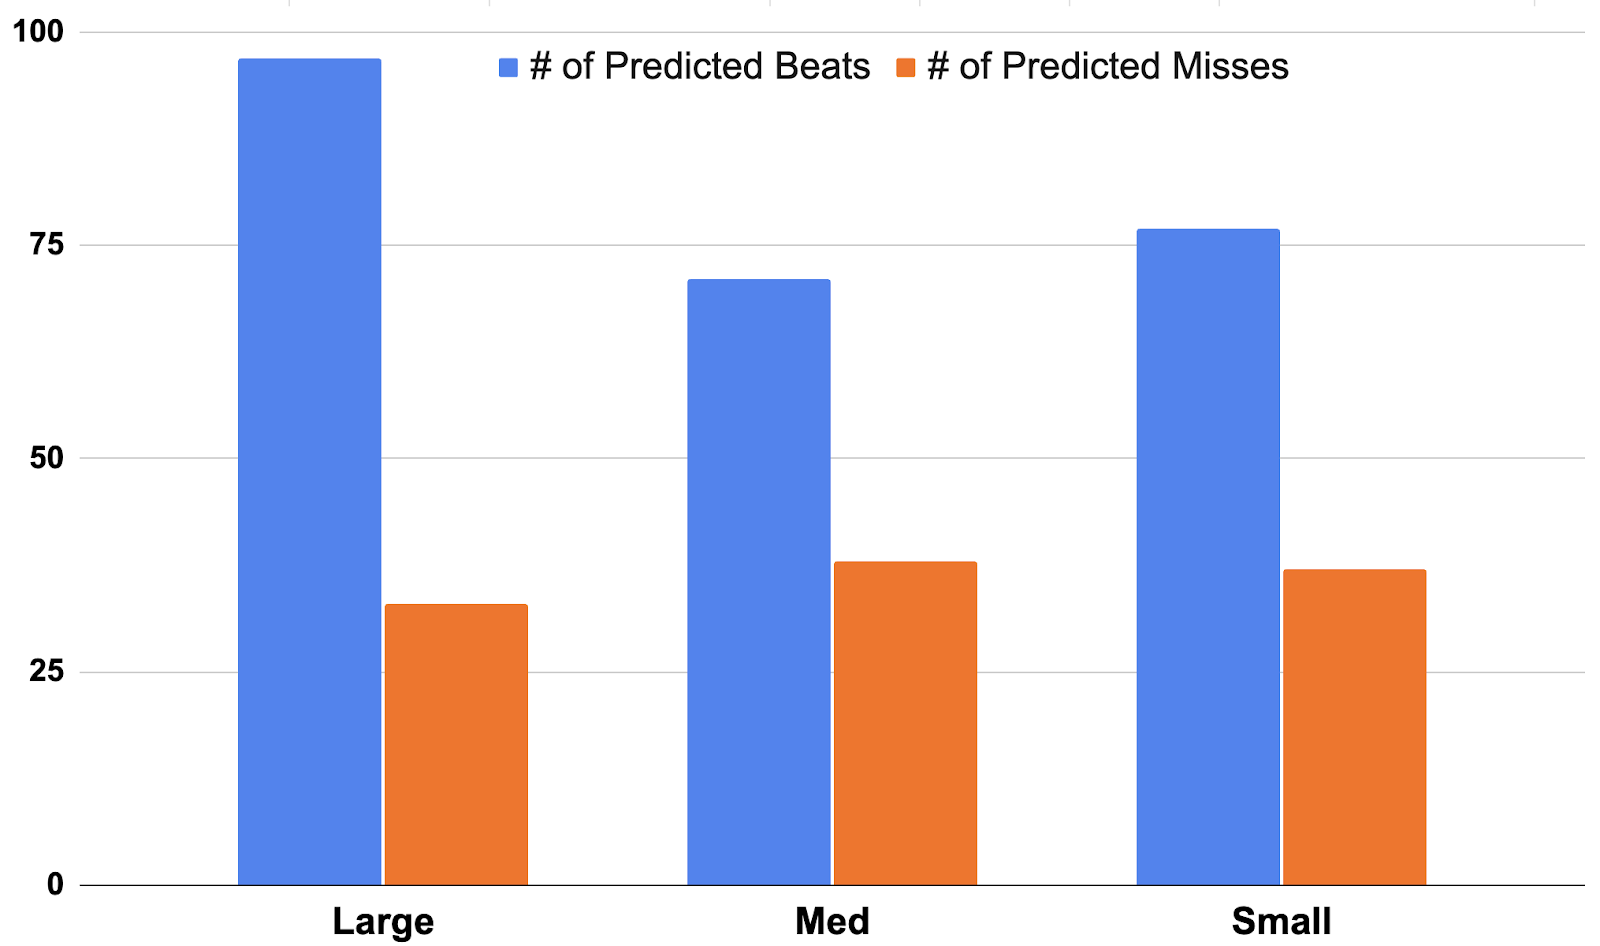
Overall, model confidence is strongest in large, well-covered companies—especially in tech and financials—while small-cap dispersion remains high but still leans net positive.
🔝Top 5 Predicted Beats This Week:
FI – 98% – Information Technology
FLEX – 96% – Information Technology
CALX – 96% – Information Technology
KARO – 93% – Information Technology
OXLC – 91% – Financials
🔻Top 5 Predicted Misses This Week:
RADA – 26% – Information Technology
GNLX – 27% – Health Care
SONN – 27% – Health Care
TNL – 27% – Consumer Discretionary
ORLY – 30% – Consumer Discretionary
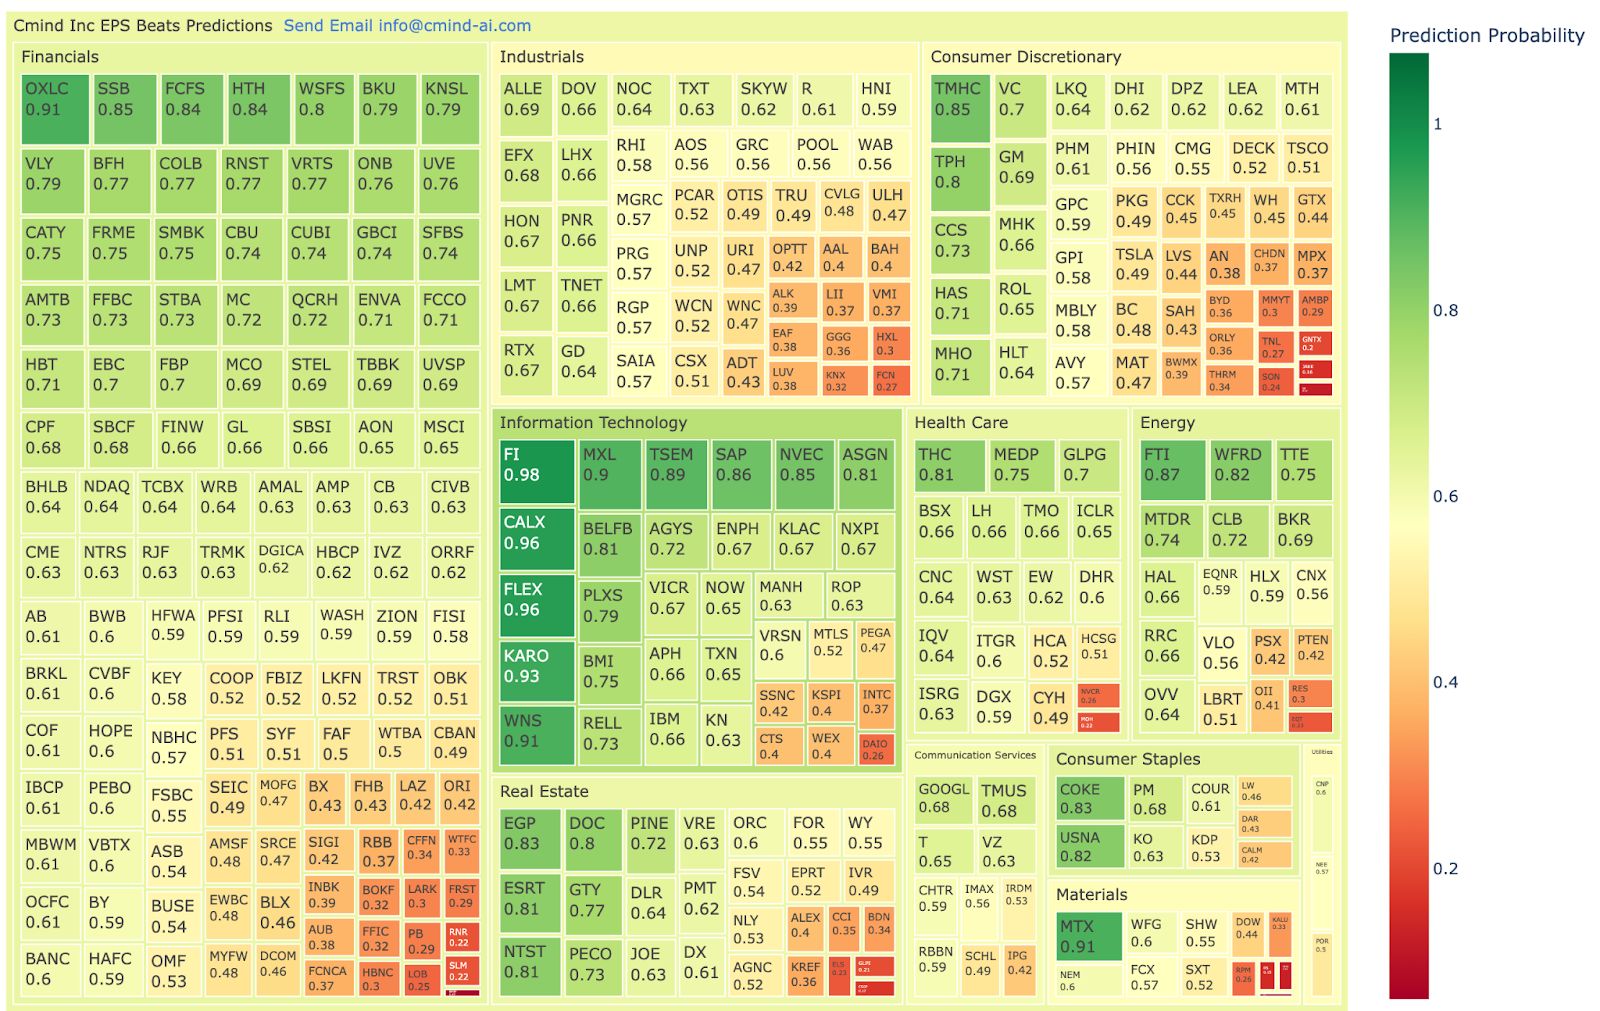
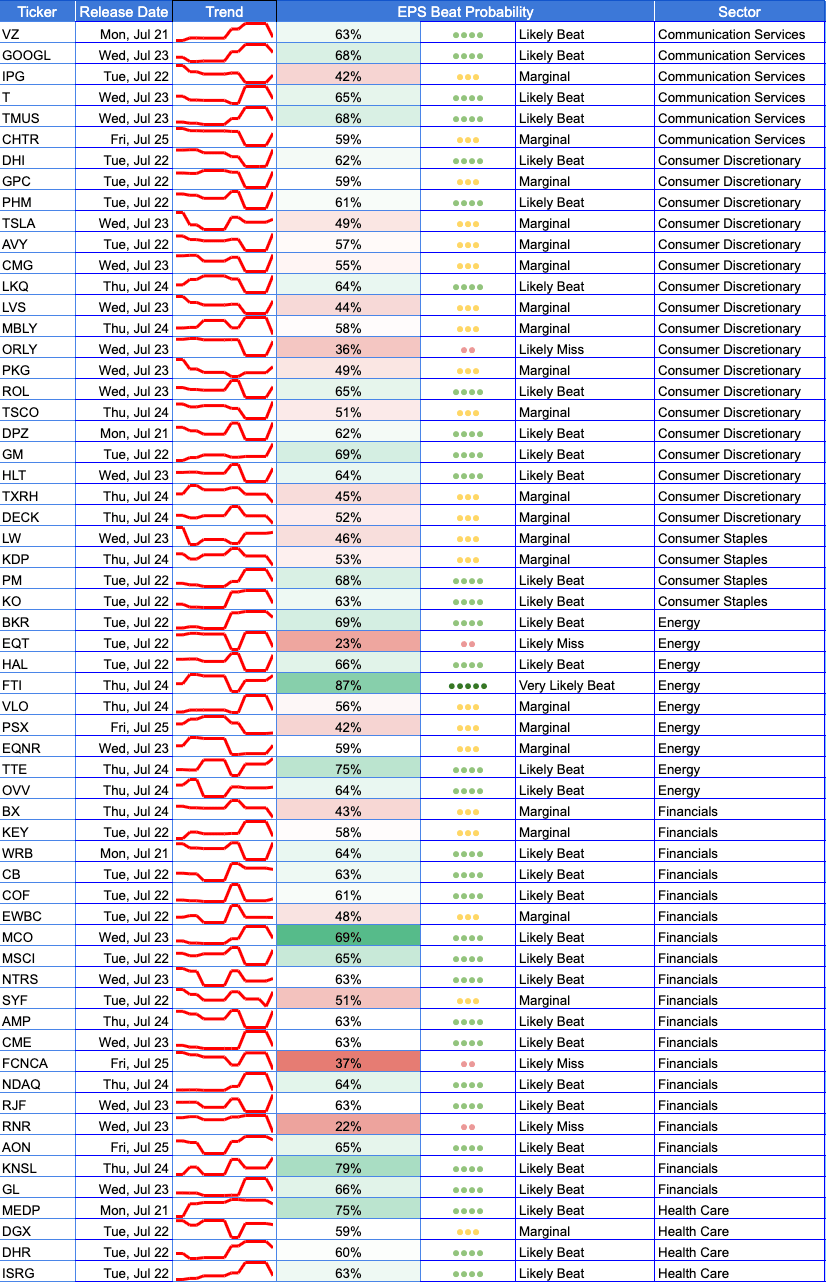
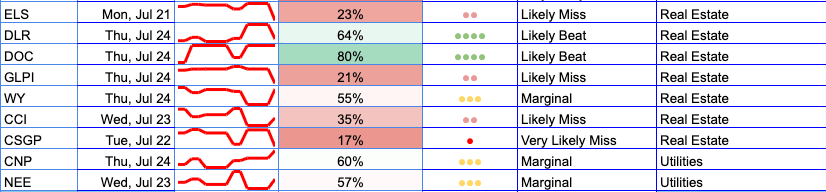
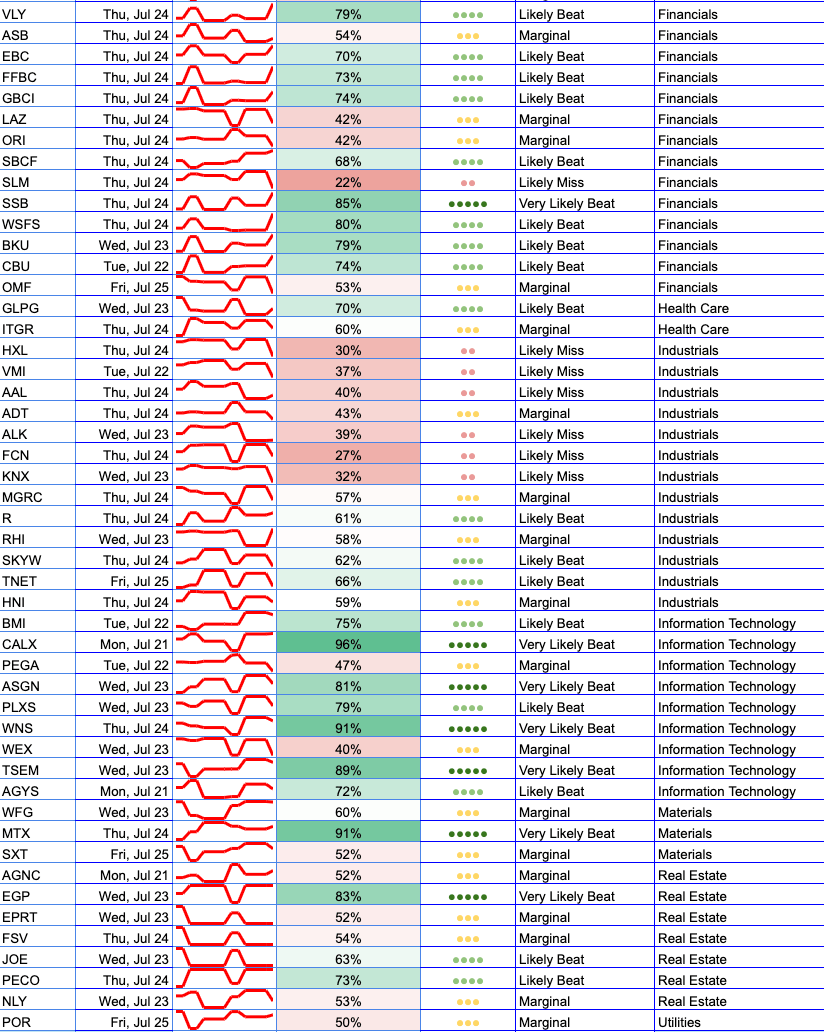
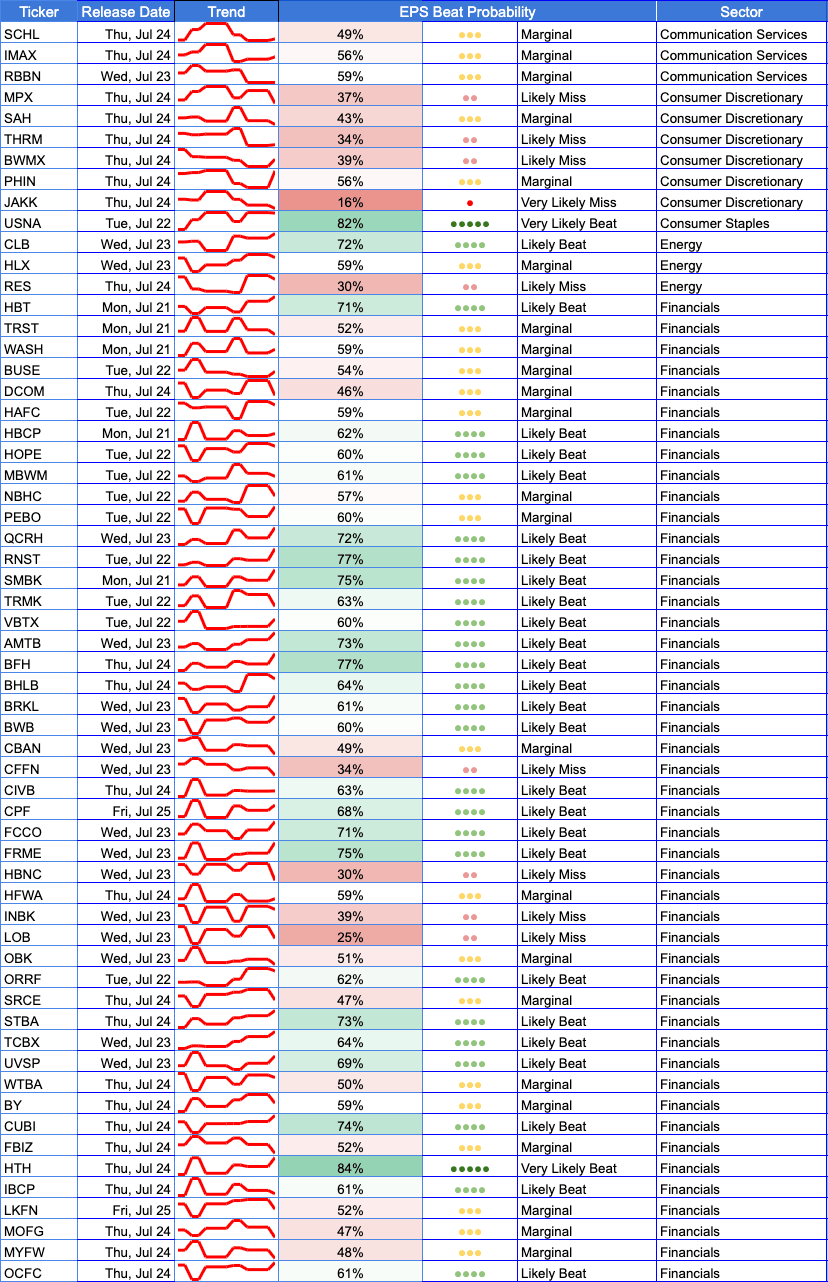
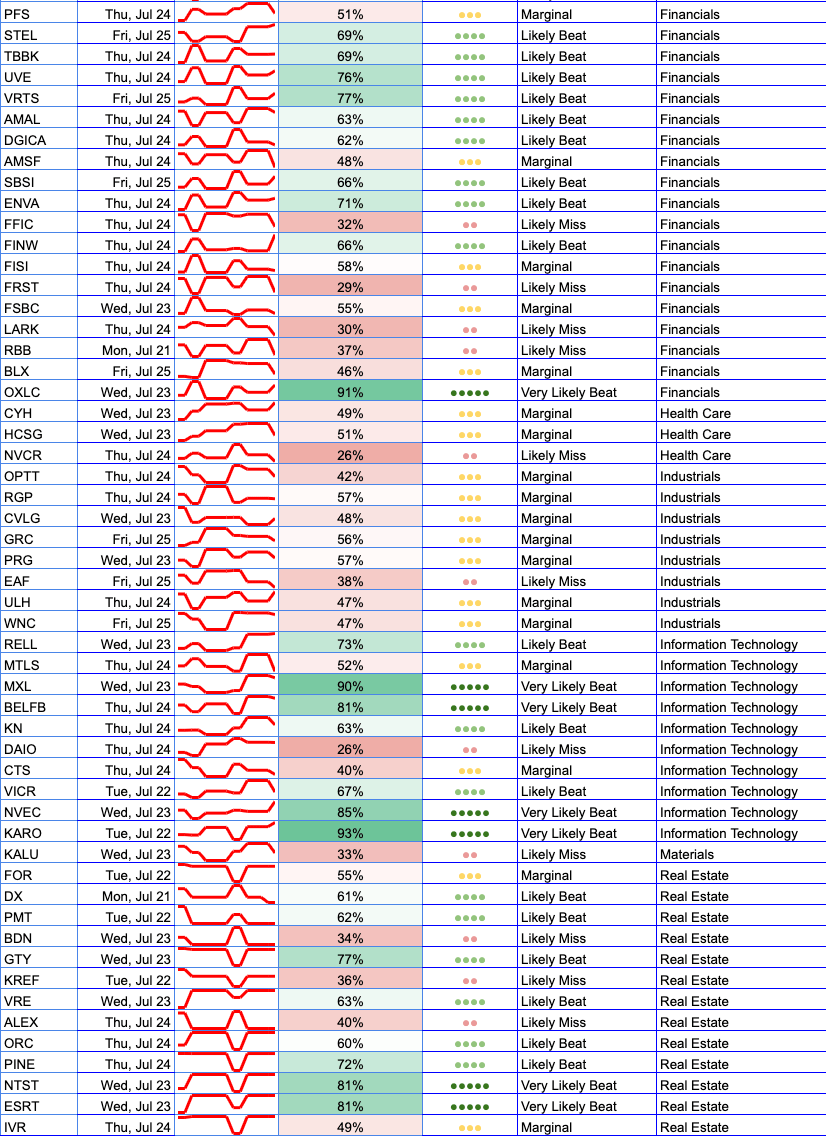
Weekly Heatmap
The visual heatmap this week highlights Information Technology and Financials as high-confidence clusters. Several names in Industrials and Energy also appear in the upper green bands, while the deepest red appears across Consumer Discretionary and select Health Care and IT laggards.
Individual Stock Predictions
Large Caps
The model flags FI (98%) and KARO (93%) as standout large-cap opportunities in Information Technology. Both have steadily risen in beat probability and outperform sector peers on profitability and analyst sentiment. Meanwhile, TSLA (47%) and ORLY (30%) represent caution flags—both with weak peer readthroughs and uncertain revisions.
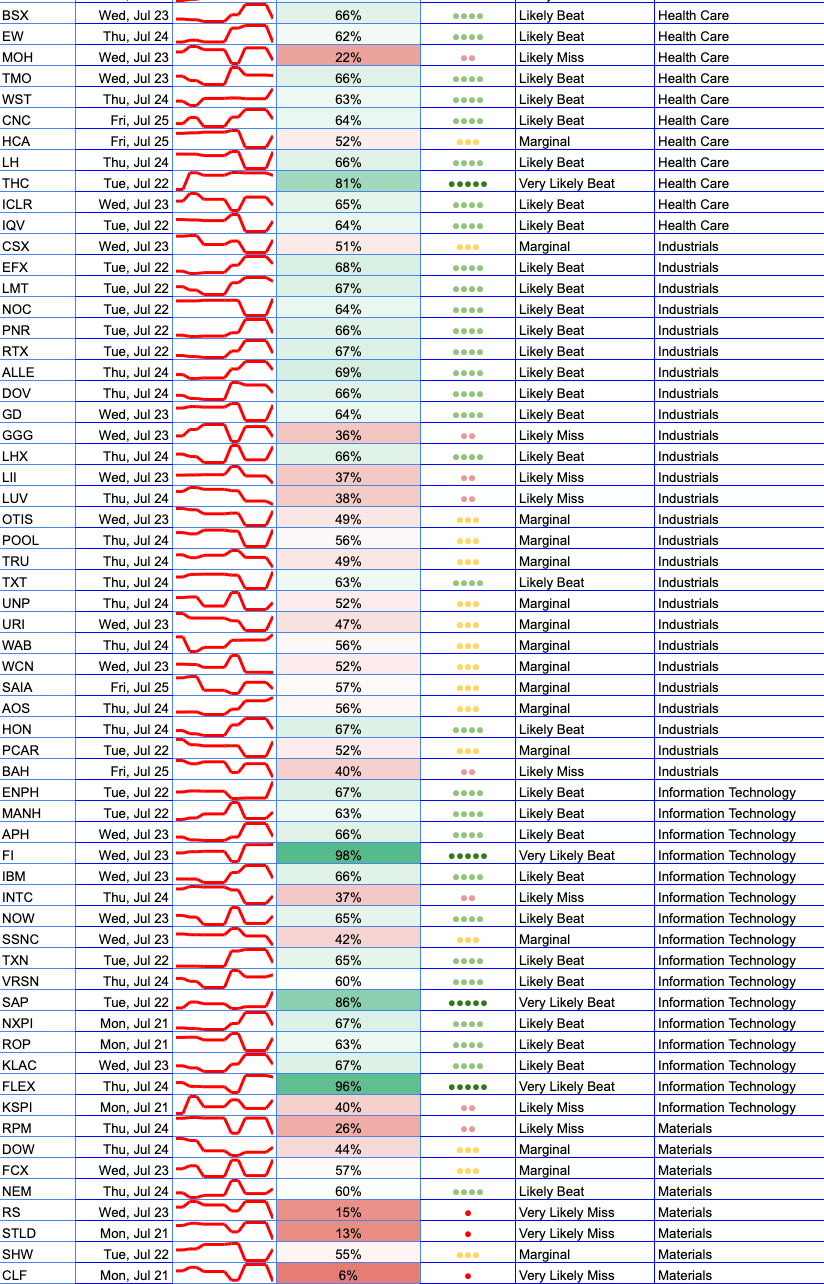
Mid Caps
FLEX (96%) and CALX (96%) lead mid-cap names, both with strong earnings trajectories, operating metrics, and peer strength. Conversely, Consumer Discretionary names like THRM and VLO show signs of softness, echoing broader weakness in cyclical retail and industrial exposure.
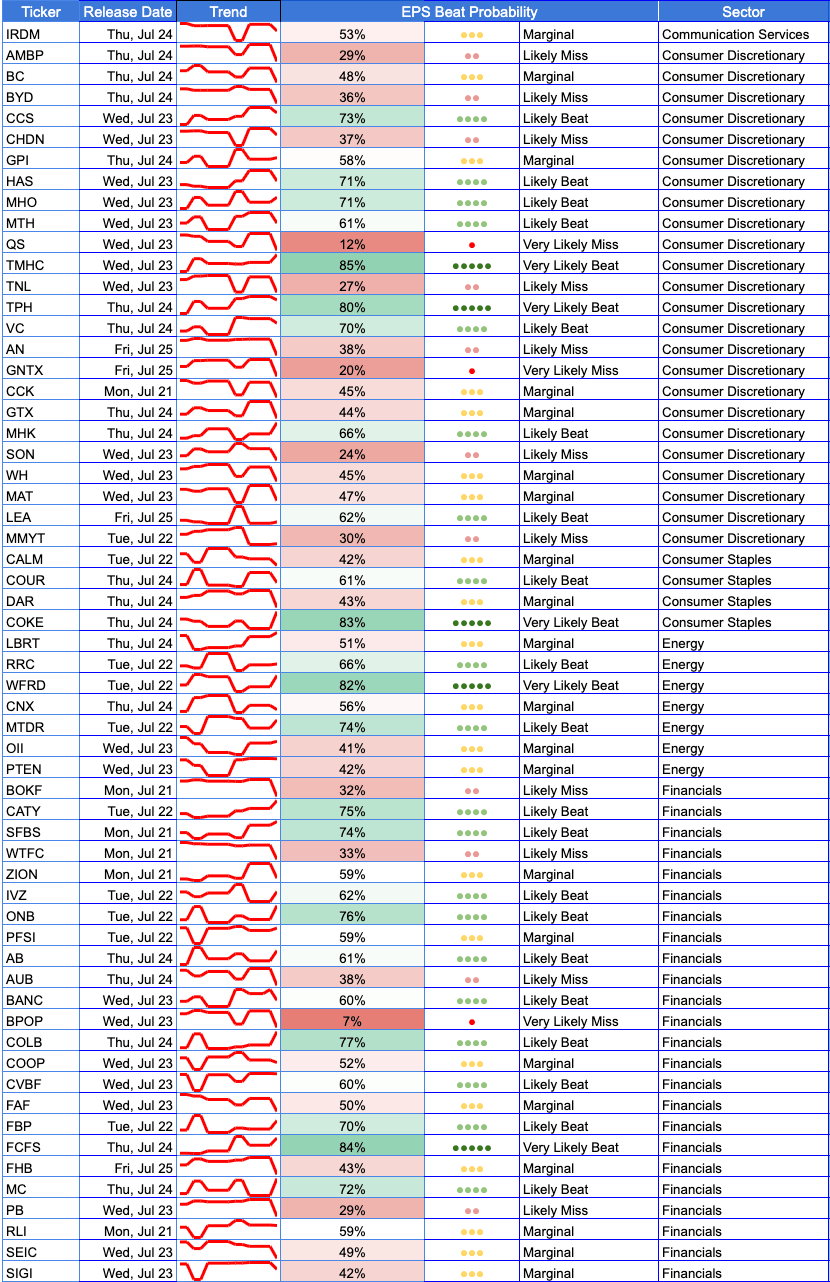
Small Caps
OXLC (91%) stands out in Financials with high profitability and peer strength, followed by niche names like TMUS (83%) and MXL (90%) in communications and semis. On the miss side, RADA (26%) and SONN (27%) reflect persistent model pessimism, largely driven by earnings quality and analyst sentiment degradation.
About the Model
Cmind AI’s EPS predictions are powered by a machine learning model built for accuracy, objectivity, and transparency. We ingest over 150 variables across six data modalities—including real-time 10-Q filings, earnings transcripts, governance metrics, and peer signals—to provide early, company-specific EPS forecasts.
Updated daily, our model covers 4,400+ public companies, with proven backtests demonstrating Sharpe and Sortino ratio improvements across portfolios.
📩 To learn more, contact us at [email protected]