- Cmind AI by Weihong Zhang
- Posts
- Forecasting AI CapEx | Feature: AMZN CapEx plateau → Forecast FY26 $148.48B
Forecasting AI CapEx | Feature: AMZN CapEx plateau → Forecast FY26 $148.48B
Microcap dispersion stays loud, Industrials/Staples skew right-tail | Beats: GIII 96 | KFY 95 | SFIX 94 | FERG 93 | KEQU 93 | ABM 93
John DiBenedetto & Weihong Zhang
March 09, 2026
Welcome to this week’s Cmind Earnings Outlook - Week of March 9–14, 2026.
This is a dispersion-first week. The calendar is still small-cap-heavy (left tail is overwhelmingly micro-cap), which means index-level “calm” can mask single-name gap risk—especially in thin-liquidity, guidance-sensitive sectors. The heatmap is doing what it’s built to do: highlight where the distribution is tightening versus where fragility is compounding.
The meta-rubric remains consistent: the tape rewards clean bridges from demand translating to cash and punishes range widening and “narrative-only” forward commentary. This market is trading the reaction function more than the print.
Feature of the Week:
CapEx Forecast: AI spend is the primary driver — free cash flow is the scoreboard
Capital expenditure (CapEx) forecasts are critical because they signal the scale of investment in artificial intelligence (AI) infrastructure, which is driving one of the largest technology build-outs in history. In this newsletter, we provide the CapEx forecast of $AMZN on a quarterly basis for 2026 using our forecast model.

This chart reframes the Amazon setup in one line: CapEx is no longer ramping — it’s becoming a regime. After running roughly in the mid-teens per quarter through 2021–2023, AMZN’s spend inflects sharply in 2024–2025 (pushing toward ~$40B by late 2025), and management’s 2026 guide-based path steps up again: $45B (Q1), $48B (Q2), $52B (Q3), $55B (Q4) — $200B total for FY2026.
For the tape, that matters because CapEx is the cleanest AI “reality check”: it hits near-term margin optics and dictates the medium-term cash-flow arc (depreciation, working capital intensity, build cadence). In this regime, the market is less interested in “who is spending” and more focused on throughput — spend → revenue → durable cash flow.
The forecast implies:
Q1’26 CapEx: $36.15B (95% CI $32.88B–$39.42B)
Q2’26: $37.29B | Q3’26: $37.37B | Q4’26: $37.62B
FY2026 forecast total: $148.48B vs FY2025A $131.8B (+12.6%)
The market can tolerate “big spend” if the company shrinks uncertainty around (a) utilization, (b) unit economics, and (c) timing of conversion into cash generation. A flat-to-up capex curve with slowing acceleration often sets up stock selection within AI: winners are names with throughput proof; losers are those with range widening and “multi-quarter ramp” vagueness.
What to watch:
AWS AI workload conversion
Margin-throughput language
CapEx cadence + composition
Cash generation bridge
AMZN’s “$200B year” anchors expectations for the broader AI infrastructure stack — semis, networking, power/utilities, and data-center ecosystems all take their cue from whether this spend is stable, accelerating, or becoming less predictable.
Top 6 Beats / Top 6 Misses (this week)
✅ Top 6 Beat probabilities
Ticker | Prob | Date | Sector | Cap |
GIII | 96% | Thu 03/12 | Consumer Discretionary | Small |
KFY | 95% | Mon 03/09 | Industrials | Small |
SFIX | 94% | Mon 03/09 | Consumer Discretionary | Small |
FERG | 93% | Tue 03/10 | Industrials | Large |
KEQU | 93% | Thu 03/12 | Consumer Discretionary | Small |
ABM | 93% | Mon 03/09 | Industrials | Small |
⚠️ Top 6 Miss probabilities
Ticker | Prob | Date | Sector | Cap |
BIOX | 11% | Tue 03/10 | Health Care | Small |
MUX | 15% | Fri 03/13 | Materials | Small |
HGBL | 24% | Wed 03/11 | Financials | Small |
HYLN | 24% | Fri 03/13 | Energy | Small |
WH | 27% | Tue 03/10 | Consumer Discretionary | Small |
STKS | 31% | Tue 03/10 | Consumer Discretionary | Small |
Right-tail is execution premium (industrial services + select consumer discretionary), while left-tail is idiosyncratic micro fragility where guidance and liquidity can dominate.
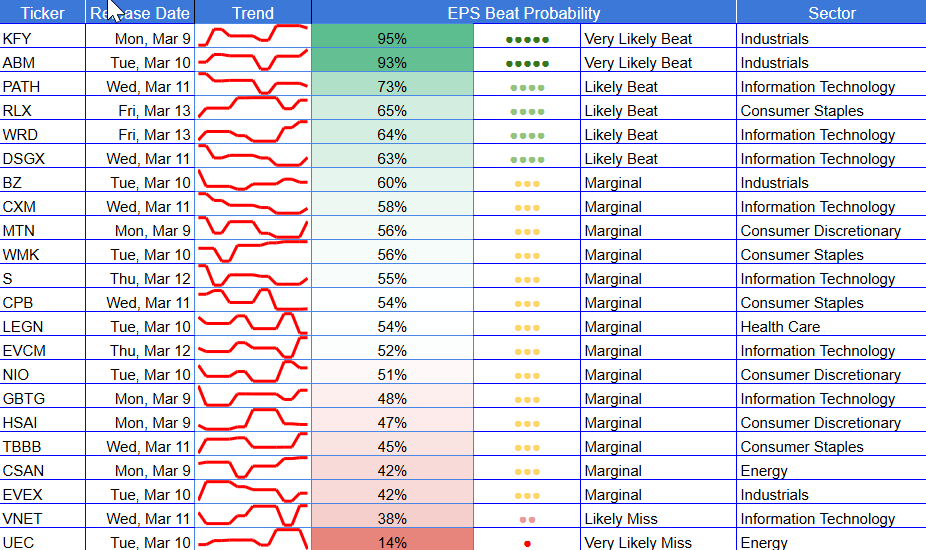
Heatmap

Overall
The board is top-heavy in “mid-green” (55-75%), consistent with a market that’s demanding proof rather than gifting multiples.
The deep reds are concentrated in small caps—that’s where reaction cones widen and “one line of guidance” can overwhelm the quarter.
Industrials show the cleanest tradable right-tail cluster (multiple names >85%), supporting basket construction.
Market cap exposure

Mega/Large cap
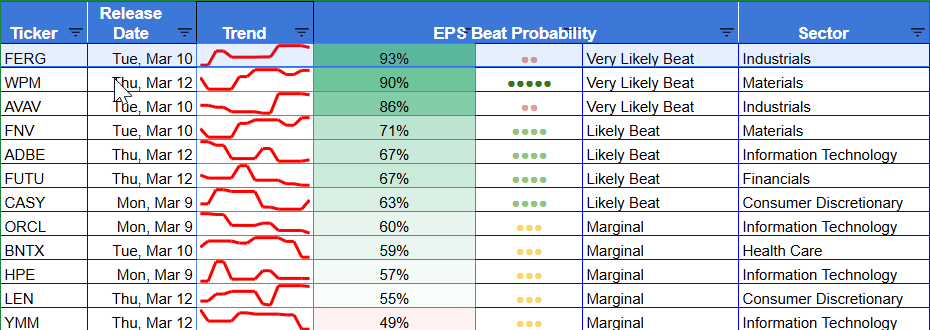
Large caps are not where the left-tail lives this week—most large names sit in the “pay me with the guide” band rather than extreme miss risk. The standouts are in Industrials: FERG (93%) screens as a true right-tail outlier, while large-cap tech/software is mostly mid-probability and therefore reaction-function dependent. For index traders, the setup is large caps stabilize the tape; small caps inject convexity.
Mid cap
Mid-caps are relatively scarce on the calendar and skew toward neutral-to-slightly-positive probabilities. That’s typically where you see cleaner pricing and less “binary” microstructure than true micro-caps, but still enough sensitivity to guidance that tight vs wide ranges matter. Watch for names drifting from 55% into the 70%+ late in the window—those transitions tend to show up as tradable tightening even when the index is flat.
Small cap

Small caps dominate the week and dominate the left tail. The data shows the overwhelming share of ≤40% probabilities living here, which is exactly where liquidity + guidance ambiguity create discontinuous gaps. At the same time, small caps also contain the highest right-tail prints (GIII/KFY/SFIX/ABM/KEQU), meaning dispersion is two-sided.
Sector exposure

Industrials:
This is the cleanest “paid-for-execution” pocket. KFY (95), ABM (93), FERG (93), FCEL (90), AVAV (86) create a tradable right tail—good for baskets because signals are converging, not scattered. The key is whether guides tighten (supports follow-through) vs widen (reaction risk despite a beat).Consumer Discretionary:
You’ve got elite right-tail names (GIII 96, SFIX 94, KEQU 93) and genuine left-tail fragility (WH 27, STKS 31, FOSL 37). This is “winners/losers in the same sector” territory—best expressed as spreads, not beta.Health Care:
Broad mid-band with extreme outliers. BIOX (11) is a true left-tail risk, while mover-flips (NUWE, LYRA, ACAD) suggest late-cycle repricing. Treat this as name-level, not sector-level.Information Technology:
Mostly mid-probability and therefore reaction-function driven. PATH (+28) stands out on the upside, while ORCL (-32) and VNET (-28) highlight “uncertainty widening” into the window.Financials:
Not a sector thesis week—more microstructure. BTBT (-22) and SSSS (-21) show left-tail drift and gap risk; the rest is mid-band.Real Estate / Staples:
RE screens relatively constructive (BRT 89, SUNS 83, REFI 77), with smaller names carrying gap risk. Staples are more stable but still depend on guidance.Materials / Energy:
Materials have a quality right-tail anchor (WPM 90) but notable fragility in smaller names (CENX/KRO/MUX). Energy is mixed and largely small-cap driven (HYLN 24).
Top Movers (±10 pts change - Week over Week)
These are signal movers, not price movers — measuring changes in probability relative to last week.
✅ Biggest positive deltas
Ticker | Prob | Δ pts | Sector | Cap | Date |
NUWE | 58% | +48 | Health Care | Small | Tue 03/10 |
LYRA | 63% | +43 | Health Care | Small | Tue 03/10 |
INDP | 48% | +40 | Health Care | Small | Wed 03/11 |
TTGT | 83% | +40 | Communication Services | Small | Wed 03/11 |
KEQU | 93% | +37 | Consumer Discretionary | Small | Thu 03/12 |
TBRG | 80% | +34 | Health Care | Small | Tue 03/10 |
SGA | 61% | +33 | Communication Services | Small | Wed 03/11 |
ACAD | 73% | +32 | Health Care | Small | Tue 03/10 |
BIRD | 50% | +29 | Consumer Discretionary | Small | Tue 03/10 |
KRT | 60% | +29 | Consumer Discretionary | Small | Tue 03/10 |
PATH | 73% | +28 | Information Technology | Med | Mon 03/09 |
BMBL | 43% | +28 | Information Technology | Small | Mon 03/09 |
⚠️ Biggest negative deltas
Ticker | Prob | Δ pts | Sector | Cap | Date |
ORCL | 60% | -32 | Information Technology | Large | Mon 03/09 |
CENX | 43% | -30 | Materials | Small | Tue 03/10 |
PLBY | 66% | -29 | Consumer Discretionary | Small | Thu 03/12 |
VNET | 38% | -28 | Information Technology | Small | Mon 03/09 |
FOSL | 37% | -27 | Consumer Discretionary | Small | Tue 03/10 |
ACXP | 67% | -26 | Health Care | Small | Tue 03/10 |
UONE | 64% | -25 | Communication Services | Small | Wed 03/11 |
NOTE | 54% | -25 | Information Technology | Small | Mon 03/09 |
KLXE | 45% | -23 | Energy | Small | Tue 03/10 |
KRO | 41% | -23 | Materials | Small | Tue 03/10 |
BTBT | 50% | -22 | Financials | Small | Thu 03/12 |
SSSS | 43% | -21 | Financials | Small | Tues 3/10 |
This week’s Top Movers are telling you where the expectations distribution is changing fastest, not where prices already moved. The big upside flips (e.g., NUWE +48, LYRA +43, INDP +40, TTGT +40, KEQU +37) cluster in small-cap Health Care + Communications + Consumer, which is typical of late-window re-rating: the model is seeing a tighter pre-print profile, but liquidity can still amplify outcomes. The largest downside resets (ORCL -32, CENX -30, PLBY -29, VNET -28, FOSL -27) are more “fragility flags” than outright miss calls—often signaling guide sensitivity.
Setup for next week
Expect dispersion to persist, but the tape’s grading rubric stays the same: payback timelines and cash conversion beat storytelling. This week map which sectors are showing tightening distributions versus widening ranges. That’s typically the cleanest pre-positioning signal before the next heavier leg of earnings breadth.
About the Model
Cmind AI’s EPS predictions are powered by a machine learning model built for accuracy, objectivity, transparency, and daily updates with the latest market information. We ingest over 150 variables across five data modalities—including real-time 10-Q filings, earnings transcripts, governance metrics, and peer signals—to provide early, company-specific EPS forecasts.
Our EPS signals update daily across 4,400+ U.S. stocks using a multi-input ML model (filings, transcripts, price/earnings dynamics, governance, and peer signals). The goal isn’t to predict headlines—it’s to quantify where dispersion is most likely so you can build better baskets, hedges, and sizing into catalyst windows.
📩 To learn more, contact us at [email protected].