- Cmind AI by Weihong Zhang
- Posts
- Health Care & Real Estate Lead the Right Tail as Guidance Risk Reappears | Feature: Pricing the AI Stack - $DTE | Top Movers
Health Care & Real Estate Lead the Right Tail as Guidance Risk Reappears | Feature: Pricing the AI Stack - $DTE | Top Movers
CapEx visibility remains a primary driver of reactions—even outside the Mag 7—while mid/small-cap prints reprice faster than sector headlines.
John DiBenedetto & Weihong Zhang
February 16, 2026
Cmind Earnings Edge - Week of February 16, 2026
We’re entering the “late innings” of earnings season—the part of the calendar where index beta matters less and single-name reaction functions matter more. The heatmap this week is not screaming “risk-on” or “risk-off.” It’s signaling something more tradable: tight clusters of high-conviction beats in a few pockets, and sharp left-tail outliers where one line of guidance can overwhelm the quarter.
Highlights in this week’s board:
1) Right-tail density is real (multiple names printing 85-95% beat probabilities), especially in Health Care and Real Estate. That often shows up when the market’s pre-print distribution tightens and the model sees “execution premium” behavior.
2) The left tail is not broad—it's surgical. That’s usually where the tape is pricing fragility: guidance ambiguity, demand uncertainty, or microstructure (liquidity) risk. In these names, “beat vs miss” optics can lose to the guide.
FEATURE OF THE WEEK: Pricing the AI Infrastructure Stack — Semis, Power, and the Hidden CapEx Beneficiaries: $DTE ( ▲ 2.32% )

If the market is still debating who wins AI, it’s already pricing who powers AI. That’s where DTE screens as a “hidden CapEx beneficiary” — a regulated utility levered to grid hardening, renewables build-out, and hyperscaler/data-center load growth (i.e., lower-vol exposure to the AI infrastructure stack through rate-base expansion).
DTE is not a meme-y momentum trade — it’s an institutionally underwritten utility. The setup is “defensive growth”: management targets 6–8% operating EPS CAGR through 2030, supported by a $36.5B five-year CapEx plan (2025–2029) and a + $6.5B plan increase vs prior. The catalyst path is increasingly large-load economics: DTE has announced a 1.4 GW data-center agreement, with greater than 3 GW in additional pipeline under negotiation, and the data-center deal itself implies $6.5B of indicated incremental CapEx added to the five-year plan. New large-load wins beyond 1.4 GW, timing/size of data-center-driven CapEx, rate-case tone on cost recovery, and financing mix (equity guidance $0–$100M/yr through 2027).
What Cmind’s daily tracking implies: See the plot below for how the EPS beat probabilities evolve over time. The probability path has been choppy, but most recently lifts into the mid-to-high 60s — a “tradable, not obvious” right-tail setup where guidance and CapEx visibility can dominate the tape more than the EPS line (2/17/26, consensus $1.52).

Top Beats & Misses for Week of February 16, 2026
Top 6 Beats
CTO — 94% (Real Estate)
AMN — 93% (Health Care)
CHCT — 90% (Real Estate)
RMAX — 90% (Real Estate)
LUNG — 89% (Health Care)
WAY — 88% (Health Care)
Top 6 Misses
CZR — 17% (Consumer Discretionary)
MITT — 18% (Real Estate)
WSC — 21% (Industrials)
PDYN — 22% (Information Technology)
CRNT — 22% (Communication Services)
ASIX — 22% (Materials)
Quick interpretation: The left tail is idiosyncratic, spread across sectors. That’s a tell: the tape is not broadly derisking—it's targeting weak links where the guide can dominate.
Heatmap Read-Through

The board is clustered on the right tail, but fractured on the left.
Health Care: multiple names printing strong beat probabilities (AMN/LUNG/WAY/BLCO/PLSE etc.). This looks like an “execution premium” pocket—where the market is rewarding clarity, consistency, and defensibility.
Real Estate: the most interesting dispersion on the board. You have very high-conviction names (CTO/CHCT/RMAX/IIPR) sitting in the same sector as deep left-tail outliers (MITT, TRTX). That’s a setup for wide reaction ranges and rapid repricing on guidance.
Information Technology: bifurcation continues—quality/defensive software pockets screen well (NICE/WK/ALRM), while select names flag left-tail risk. This is not “Tech up/down”—it’s selectivity > beta.
Consumer Discretionary: the right tail has recognizable risk-on proxies (W/CVNA), but the left tail has sharp potholes (CZR, ETSY, LQK). This sector reads as gap-prone because the market is sensitive to demand tone and forward confidence.
Industrials + Materials: these show up as “middle-heavy” with a few strong right-tail names (FIX/ESAB; NTR/NEM) and a few sharp resets. That’s consistent with a tape that’s trading order books + cost discipline rather than broad macro.
Macro takeaway: We’re not in a “one-factor” week. This looks like a dispersion regime—the kind that tends to reward relative setups and punish lazy sector trades.
Market Cap Exposure
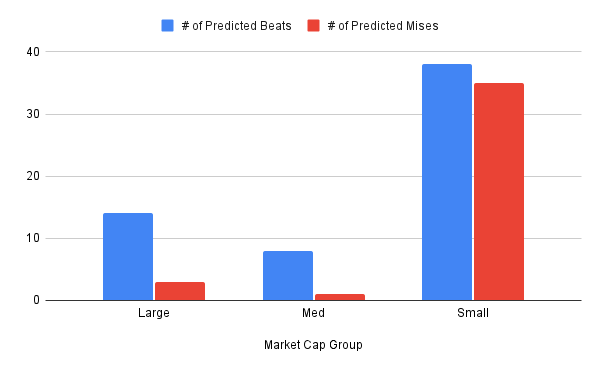
Rewarding stock selection over sector beta - The “green density” sits most visibly in Health Care and select Real Estate/Industrials, while parts of Tech + Consumer still show idiosyncratic red pockets that can gap on one line of commentary.
Mega/Large Caps

Mega & Large caps screen constructive but selective, with the right tail led by MCO (87%) and FIX (87%), plus NICE (85%) / WK (82%) / ALRM (80%)—a “quality execution premium” cluster more than a macro call. The left tail isn’t catastrophic, but it’s concentrated in names where the market will likely trade the forward range: VMC (22%), TRGP (32%), PPL (33%), HRL (39%).
Midcaps

MidCaps show the clearest two-speed behavior—enough greens to build baskets, but with real “fragility flags.” On the positive side, ESAB (0.86) stands out, with a steady set of 70-72% names (RSG 72%, GPN 71%, NPO 71%, ULS 71%). On the miss-risk side, the heatmap flags CZR (17%) and WSC (21%), with additional weak pockets in KNF (26%) and LKQ (27%).
Small Caps

Small caps are where the largest reaction cones live—both upside and downside—because probability dispersion is widest and liquidity amplifies guidance ambiguity. The right tail is dominated by Health Care: AMN (93%), LUNG (89%), WAY (88%), BLCO (87%), plus EXAS (82%) / CYH (81%). The left tail is more “gap-prone”: MITT (18%), TRTX (25%), CPT (32%), ARI (32%), BCC (37%).
Sector Exposure

Right-tail density (strongest “beats”)
Health Care: multiple high-probability names; reads as “cleanest pocket” this week.
Real Estate: high-conviction winners exist, but this sector also contains the sharpest landmines—so it’s a high-dispersion pocket.
Left-tail risk (highest “miss-risks”)
Consumer Discretionary: demand tone and forward confidence can dominate.
Select IT + Comm Services names: more fragile setups where the guide can overwhelm the print.
Isolated Materials/Industrials names: usually “company-specific problem,” not sector-wide.
Top Movers - Week over week ±10-point shifts
Overview
Real Estate dominates both tails with big ramps and big resets: i.e., a dispersion-heavy setup where guidance sensitivity can matter more than the EPS line. Health Care also shows two-sided tape. Large-cap signal moves are selective — not a blanket risk-on/off read. The board itself suggests Real Estate + Consumer Discretionary are where the “confidence ramps vs fragility flags” are most likely to show up.
✅ Upward shifts
CMTG +44 → 83% (Real Estate, Small)
SON +37 → 65% (Consumer Discretionary, Mid)
PKST +37 → 76% (Real Estate, Small)
RMAX +36 → 90% (Real Estate, Small)
CWST +35 → 70% (Industrials, Mid)
CC +34 → 53% (Materials, Mid)
LUNG +33 → 89% (Health Care, Small)
CAR +32 → 56% (Industrials, Mid)
BRSP +32 → 80% (Real Estate, Small)
LOPE +32 → 77% (Consumer Staples, Mid)
CTO +28 → 94% (Real Estate, Small)
VENU +28 → 46% (Communication Services, Small)
RS +27 → 54% (Materials, Large)
PLSE +26 → 84% (Health Care, Small)
W +26 → 80% (Consumer Discretionary, Mid)
LAMR +26 → 77% (Real Estate, Large)
PRTA +25 → 74% (Health Care, Small)
AMH +25 → 80% (Real Estate, Large)
TALK +25 → 78% (Health Care, Small)
DBRG +25 → 79% (Real Estate, Mid)
⚠️ Downward shifts
OPEN -45 → 34% (Real Estate, Small)
MD -37 → 34% (Health Care, Small)
BILI -35 → 58% (Communication Services, Large)
LAUR -32 → 54% (Consumer Staples, Mid)
OGE -31 → 39% (Utilities, Mid)
FVRR -30 → 52% (Communication Services, Small)
SSII -29 → 28% (Health Care, Small)
ASIX -27 → 22% (Materials, Small)
MHH -24 → 53% (Industrials, Small)
TRTX -24 → 25% (Real Estate, Small)
MITT -23 → 18% (Real Estate, Small)
HLMN -23 → 51% (Industrials, Small)
COCO -22 → 67% (Consumer Staples, Mid)
ENVX -22 → 48% (Industrials, Mid)
CARG -22 → 63% (Consumer Discretionary, Mid)
KVUE -22 → 72% (Consumer Staples, Large)
JLL -21 → 66% (Real Estate, Large)
BJRI -20 → 64% (Consumer Discretionary, Small)
RMNI -20 → 36% (Information Technology, Small)
FDP -20 → 37% (Consumer Staples, Small)
Options Desk Note
This appears to be a selective IV-crush week, not a blanket one. Where you see right-tail clustering (Health Care, parts of Real Estate), the market often enters with tighter distributions—post-print IV can compress quickly if the guide confirms.
The left tail is more dangerous: names like CZR / MITT / PDYN / CRNT are the kind where a single guidance sentence can widen the forward range and keep IV sticky (or even reprice vol higher). For index/ETF traders: the lack of mega-cap concentration means single-name vol matters more than index vol—dispersion over beta is the clean setup.
Setup for Next Week
Next week is typically when the calendar shifts attention back toward fewer, larger catalysts and “read-through” trades—especially if markets are still debating AI payback timelines and CapEx discipline. We’ll frame it the same way: who has measurable outputs, and who is still selling a narrative.
About the Model
Cmind AI’s EPS predictions are powered by a machine learning model built for accuracy, objectivity, transparency, and daily updates with the latest market information. We ingest over 150 variables across five data modalities—including real-time 10-Q filings, earnings transcripts, governance metrics, and peer signals—to provide early, company-specific EPS forecasts.
Our EPS signals update daily across 4,400+ U.S. stocks using a multi-input ML model (filings, transcripts, price/earnings dynamics, governance, and peer signals). The goal isn’t to predict headlines—it’s to quantify where dispersion is most likely so you can build better baskets, hedges, and sizing into catalyst windows.
📩 To learn more, contact us at [email protected]