- Cmind AI by Weihong Zhang
- Posts
- Industrials Stay an Execution Tape; Tech Remains Two Trades | Earnings Wall + AMD
Industrials Stay an Execution Tape; Tech Remains Two Trades | Earnings Wall + AMD
Earnings breadth peaks Thursday; monetize dispersion and keep risk defined—AMD in focus.
John DiBenedetto & Weihong Zhang
November 03, 2025
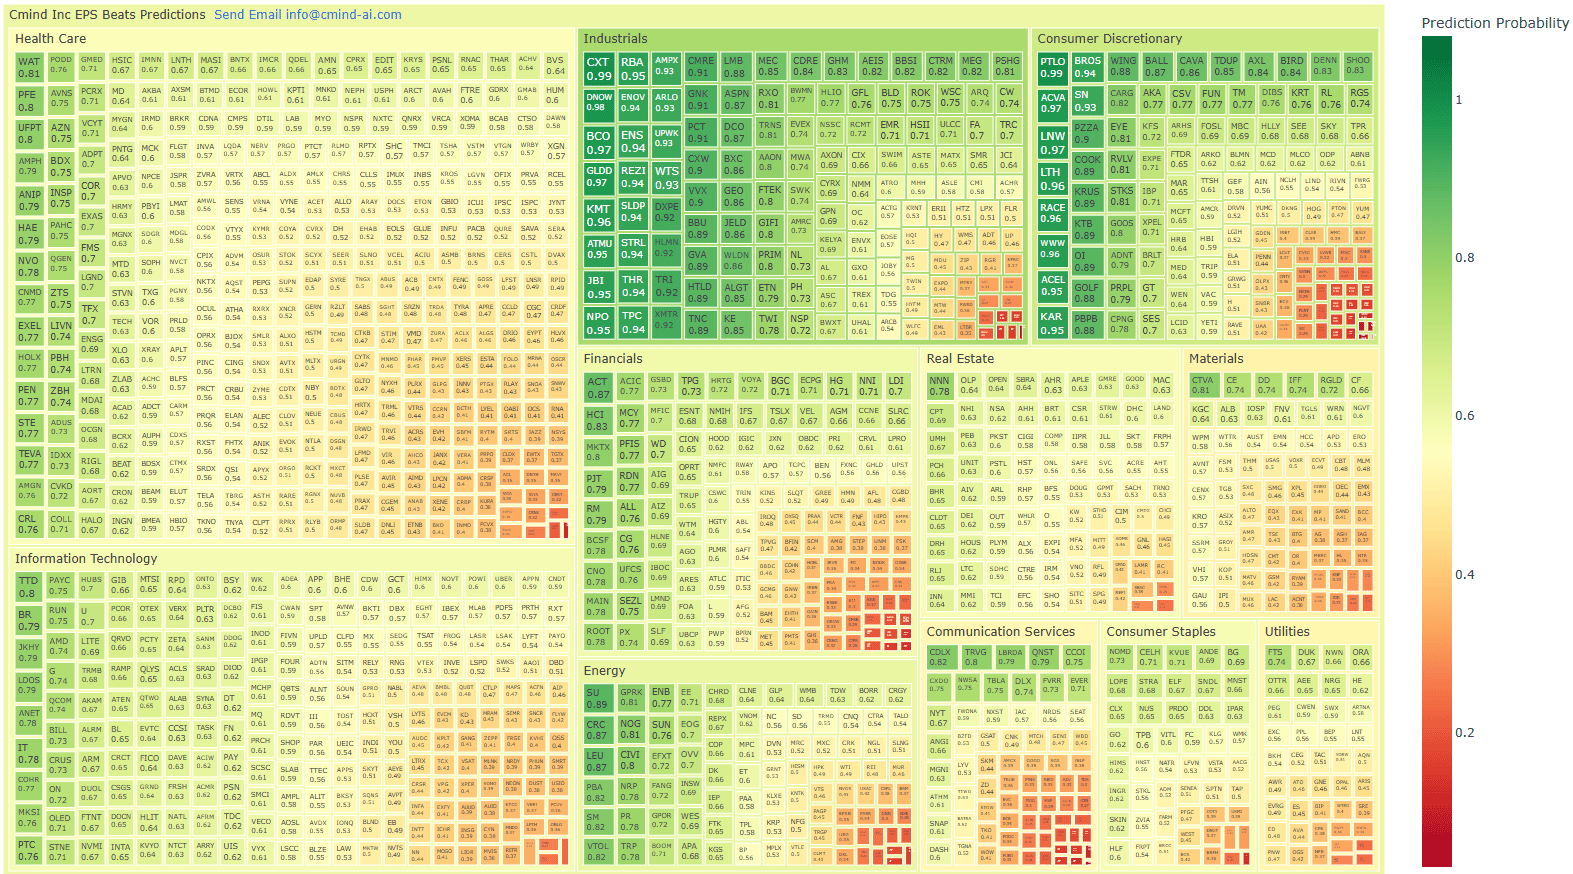
Earnings season shifts from a handful of marquee narratives to an actual breadth test. With 1400+ companies reporting across every sector—literally a “wall” of prints mid-week (Thurs)—the tape favors process over punditry: read the guidance, respect dispersion, and let single-name conviction do the work. That’s precisely how our heatmap wants you positioned. It favors execution-driven Industrials and core Information Technology while keeping a cautious lens on rate-sensitive Real Estate and financing-dependent pockets of Financials. The pattern argues for a stock-selection tape—neutralize index beta and lean into the gradients the model is flagging.
The calendar alone will amplify moves. Thursday is the peak: 500+ companies report the same day, a cluster that typically elevates cross-currents in both guidance and price action. Expect intraday reversals around management commentary and a premium on pre-call positioning that can be quickly neutralized if outlooks wobble. For options folks, that Thursday pile-up historically offers event-vol to sell steadier names and targeted convexity to buy around idiosyncratic risk.
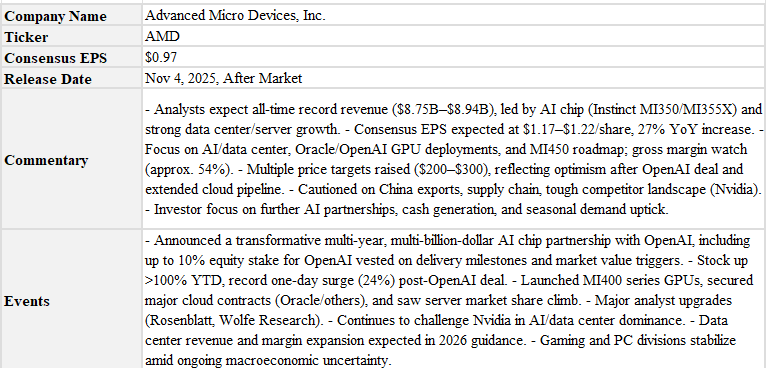
Stock Analysis: AMD
The upcoming AMD earnings release is among the most significant events for both the semiconductor and AI sectors in 2025.
AMD recently signed a multi-year, multi-billion-dollar partnership with OpenAI to supply up to 6 gigawatts of Instinct AI GPUs, making AMD a central player in next-generation AI infrastructure. The deal provides OpenAI an option to acquire up to 10% of AMD equity, with stock vesting tied to GPU deployment milestones and market price targets.
Investors and analysts will watch for roadmap updates (MI450/Helios), supply chain scale-up plans, and new customer momentum, as AMD leverages recent breakthroughs for future growth.
AMD’s AI accelerator market share is expected to increase significantly, challenging Nvidia’s dominance and diversifying the supplier landscape for major AI firms.
AMD is evolving from a CPU cyclical into a multi-engine datacenter story—if AI accelerators scale with healthy margins and return of capital keeps closing the software gap, earnings power steps up; if supply or ecosystem lags, prints stay choppy and mix-driven.
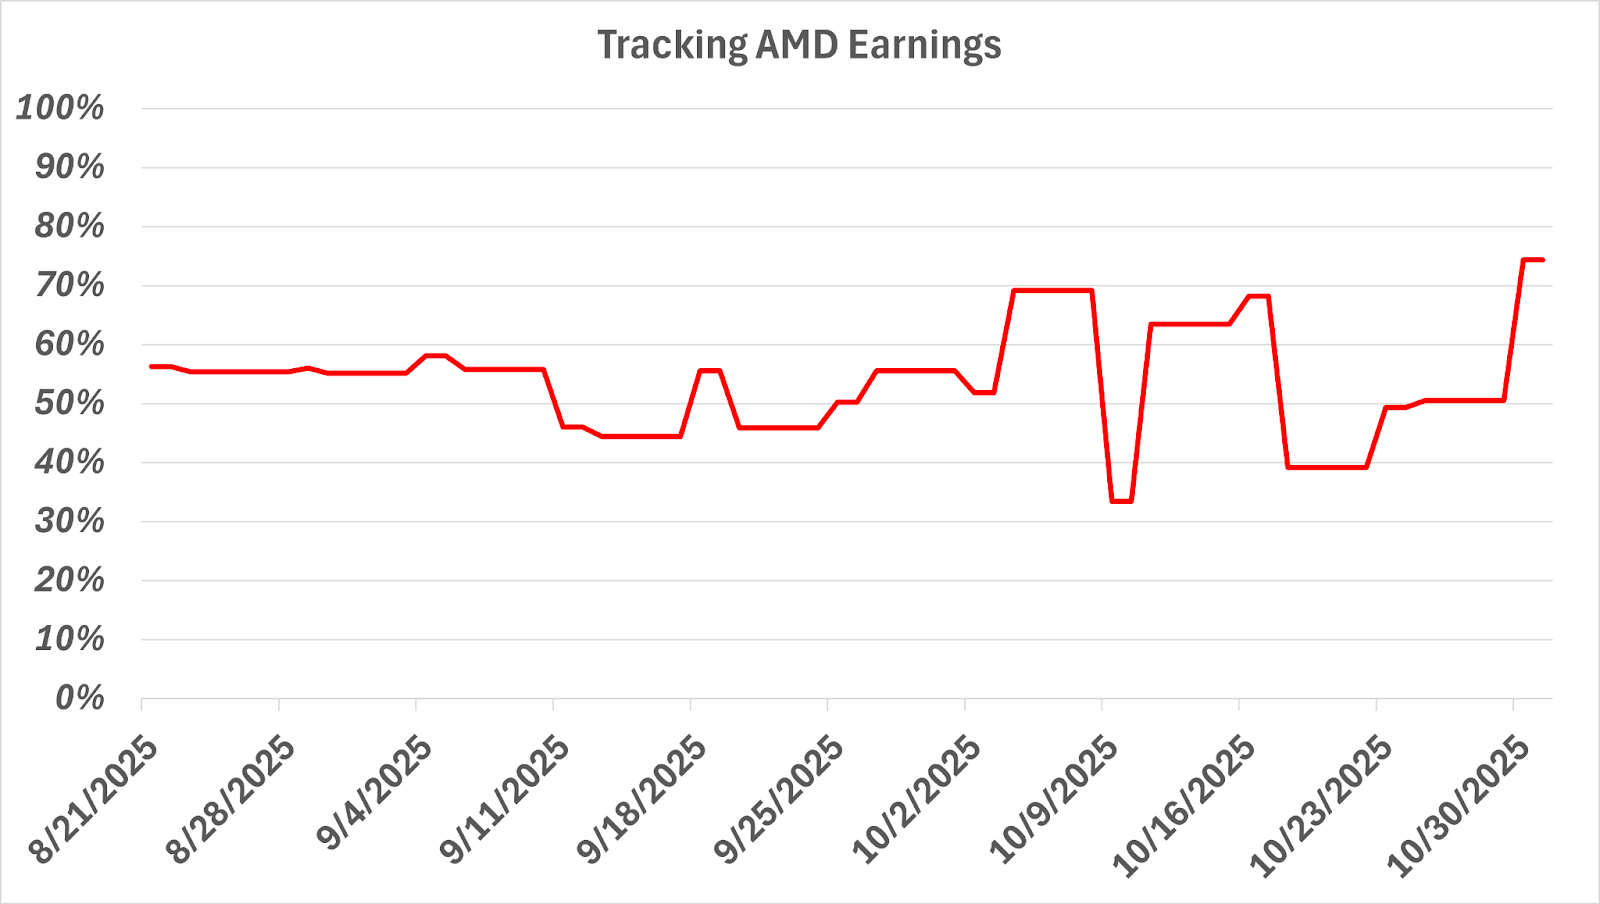
See how our model tracks the earnings beat, major commentaries and corporate events on a daily basis since its last earnings release.
Industrials read like an execution tape: pricing/mix and backlog visibility light up multiple sub-buckets—machinery, transports, services—shines of a steady post-call drift. Materials show selective strength where specialty and industrial chemicals sit, while more commodity-linked names lag.
Financials are a barbell. Core banks and insurers trend green while a compact red cluster builds in consumer credit and alt-finance. Optionality is split: keep upside in quality lenders/insurers, and express skepticism in the red pocket. The heatmap is essentially telegraphing the holiday credit debate—we’ll look into next week’s commentary to extend.
Technology is where correlation goes to die. Platform names tied to cloud/AI/ads lean green, but the long tail—peripherals, some analog, and smaller software—skews orange/red. Communication Services rhymes with Tech: platforms look fine, smaller media does not—again, a dispersion canvas rather than a blanket bet.
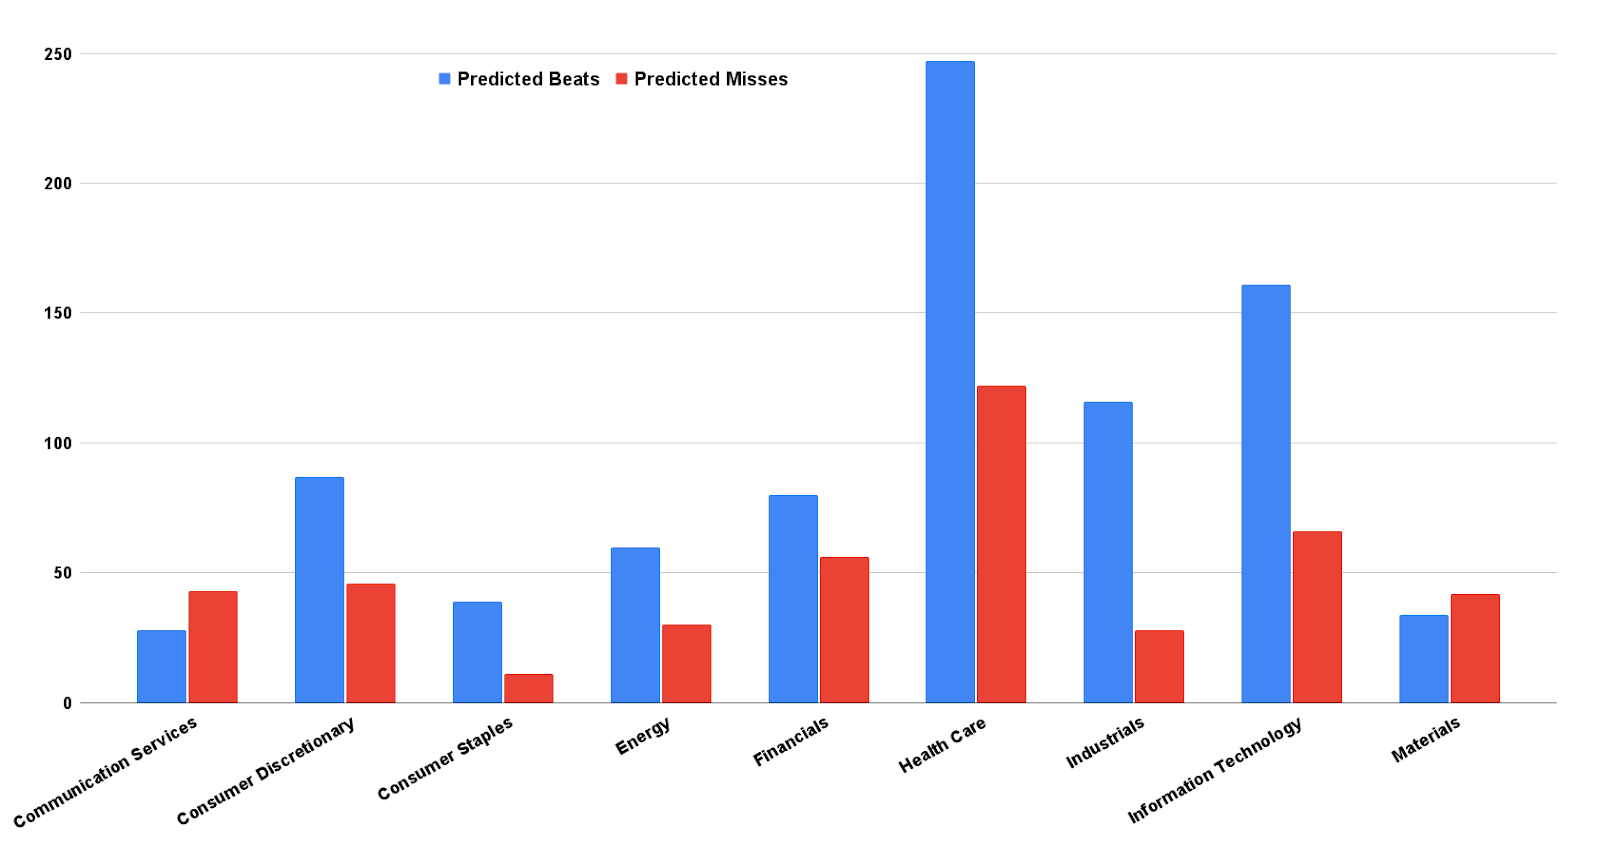
This week’s heatmap still screams dispersion. The deep-green clusters are concentrated in Industrials (execution + backlog visibility), plus select Consumer Discretionary names with genuine pricing power/brand equity. Ambers/Reds cluster in rate-sensitive Real Estate, ad-dependent media, and promotion-heavy retail.
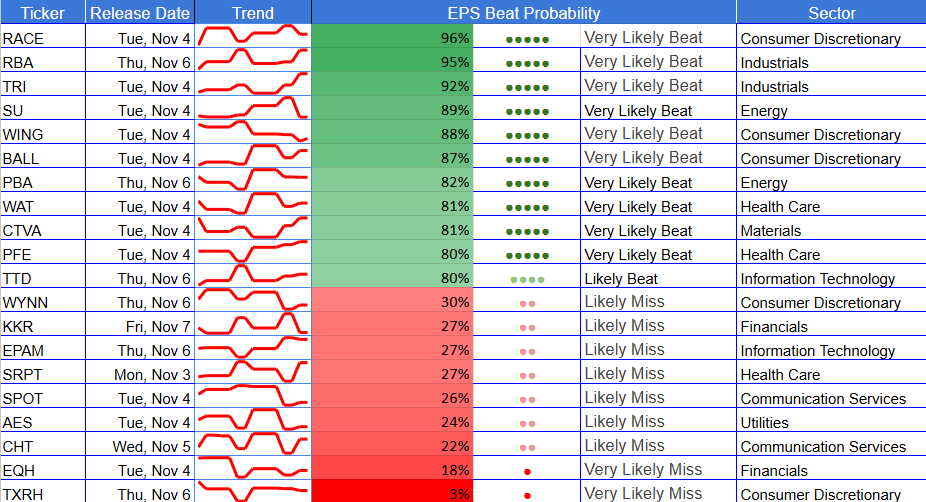
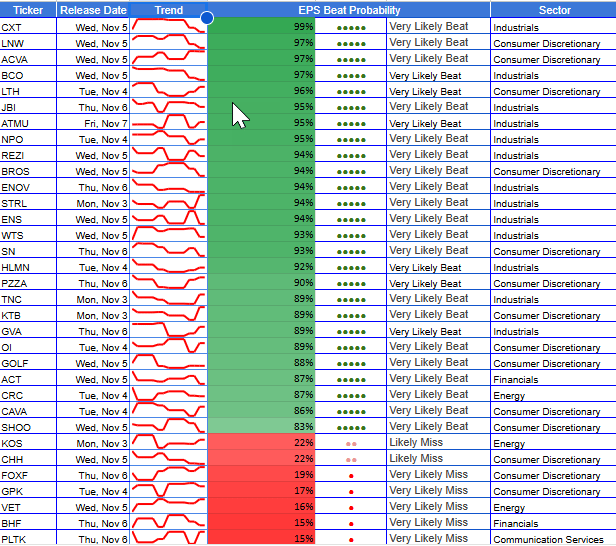
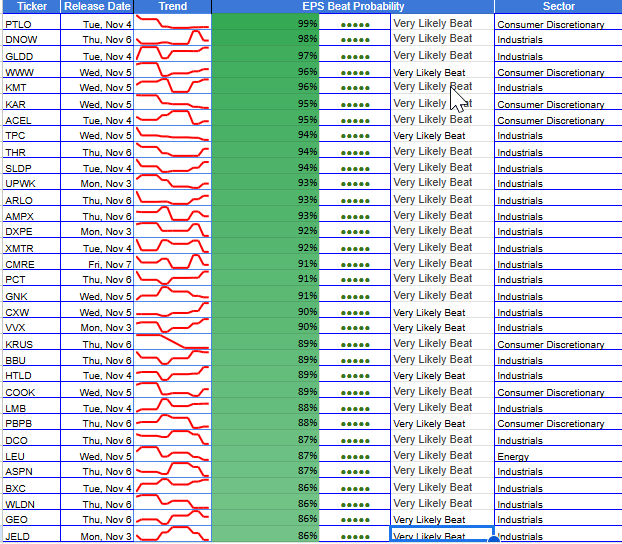
🔝 Top 6 Predicted Beats This Week
CXT (Nov 5) – 98% – Industrials – Mid Cap
PTLO (Nov 4) – 99% – Consumer Discretionary – Small Cap
DNOW (Nov 6) - 98% - Industrials - Small Cap
LNW (Nov 5) – 97% – Consumer Discretionary - Mid Cap
ACVA (Nov 5) - 97 - Consumer Discretionary - Mid Cap
GLDD (Nov 4) - 97% - Industrials - Small Cap
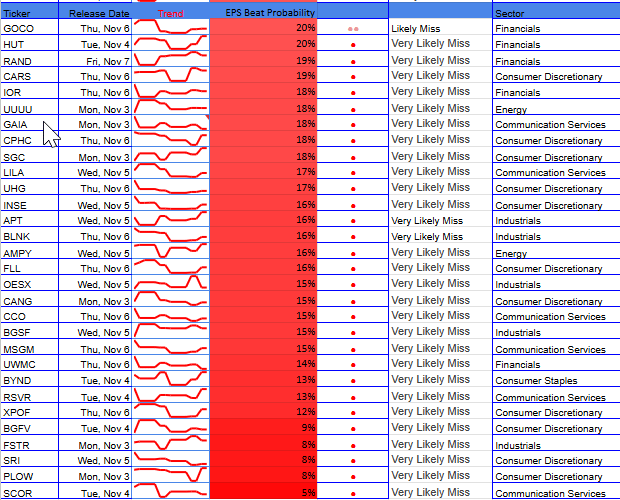
🔻Top 6 Predicted Misses This Week
TXRH (Nov 6) – 3% – Consumer Discretionary – Large Cap
SCOR (Nov 4) – 5% – Communication Services – Small Cap
PLOW (Nov 3) - 8% - Consumer Discretionary - Small Cap
SRI (Nov 5) – 8% – Consumer Discretionary – Small Cap
FSTR (Nov 3) - 8% - Industrials - Small Cap
BGFV (Nov 4) – 9% – Consumer Discretionary – Small Cap
(As of October 30, 2025)
The map skews dispersion, not direction. You’ve got contiguous green in Industrials/Utilities (broad execution, stable guides), select green pockets in Materials and quality Discretionary, and a two-tone Technology block: platform leaders look resilient while the long tail trends orange/red. Financials show a barbell - majors/insurers are firm, consumer credit is soft. Real Estate is split: logistics/residential acceptable with office landmine. Health Care is a mosaic—tools/devices steadier than small-cap biotech.
Click here or the following heat-map to see an interactive version of it.
Next Week & Q4 Setup
The heatmap is broadcasting where to be selective. Carry the green: Keep post-print rolls in Industrials/Utilities where beats turn into 2–3 week drift. Maintain single-name vs. index in Tech—platform leaders vs. long-tail laggards—into early-Q4 AI/PC/mobile updates. We expect Financials spread to widen as holiday guidance lands; quality lenders/insurers over subprime/alt-finance.
Individual Stock Predictions
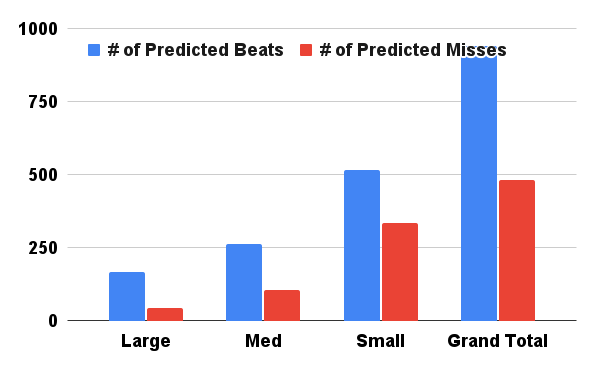
Large Caps
Large-cap breadth tilts constructive but dispersion is real. Defensives and semis lead the tape: PFE 80% anchors health-care resilience, while AMD 74% and QCOM 74% keep the semi complex in the “likely beat” column. Consumer/commerce platforms look more balanced than bullish—ABNB 61%, UBER 60%, SHOP 59%—with upside dependent on cost discipline and unit-economics updates rather than top-line momentum.
On the weak end, MRNA 44% sits in the bottom half of the distribution as vaccine comps, R&D cadence, and pipeline timing dominate the narrative. In summary, large-cap setup favors quality + operating leverage over broad beta—own the names where mix and pricing still translate to EPS (PFE/AMD/QCOM), and be selective with platform exposure where engagement and ad-load elasticity drive the print. It continues to call for single-name over index.
Mid Caps
Mid-caps show the cleanest spread this week and we consider this to be the alpha-dense layer. Industrial distributors, testing/inspection, aerospace/defense subs, and project services with price/mix + cost programs light up green. The right tail clusters around execution stories with cost control and backlog/mix: BCO 97%, LNW 97%, ACVA 97%, KMT 96%, LTH 96%. The left tail is striking and idiosyncratic: TNDM 12%, CABO 12%, PLTK 15%—each tied to product cycle or unit-growth uncertainty and potential expense drift. Translation: mid-cap dispersion is earned, not noise. It’s a good hunting ground for pairs (e.g., BCO/LNW vs. TNDM/CABO), select mid-cap tech tied to automation/workflow also screens well. Tread lightly with channel-dependent consumer stories and single-product tech vendors carry gap risk.
We highlight multiple top-decile tiles across mid-cap Industrials and specialty Consumer with several with 95%+ scores, while a tail of communication/retail screens are in the bottom decile. It’s a story of long executors vs fragile peers.
Small Caps
Small-caps remain the most “barbelled”: at the high end, asset-light operators and niche industrials such as GLDD 97% and WWW 96% screen as very likely beats—often driven by backlog visibility, pricing power, and tight SG&A control. Walk carefully where the broadest red cluster sits in micro-cap retail/media/long-tail tech. The low end tilts toward stressed consumer and micro-cap media/advertising: FSTR 8%, BGFV 9%, XPOF 12%, RSVR 13%, plus CCO 15% and OESX 15%. With liquidity thinner and pre-announcement risk higher, expect outsized post-print drift in both directions—i.e., a fertile setup for dispersion rather than directional small-cap beta.
This is a dispersion tape. Neutralize beta, press spreads where the gradients are sharpest (Tech long-tail, REIT split, Financials barbell), and let the heatmap guide which names you carry beyond the headline. Next week, and into Q4, the same playbook should compound: trade the spread, not the story.
About the Model
Cmind AI’s EPS predictions are powered by a machine learning model built for accuracy, objectivity, and transparency. We ingest over 150 variables across six data modalities—including real-time 10-Q filings, earnings transcripts, governance metrics, and peer signals—to provide early, company-specific EPS forecasts.
Updated daily, our model covers 4,400+ public companies, with proven backtests demonstrating Sharpe and Sortino ratio improvements across portfolios.
📩 To learn more, contact us at [email protected]