- Cmind AI by Weihong Zhang
- Posts
- Mag 7 Week 2: CapEx Payback Timelines Go On Trial | AMZN + GOOGL as the scorecard | Top Movers
Mag 7 Week 2: CapEx Payback Timelines Go On Trial | AMZN + GOOGL as the scorecard | Top Movers
Cmind’s read-through: the print matters, but the guide and CapEx sensitivity lens often decides the reaction | Dispersion elevated in small-cap left tails
John DiBenedetto & Weihong Zhang
February 02, 2026
Hi, Welcome to the Cmind Earnings Edge.
This is the week the market stops pricing AI narratives and starts pricing AI payback timelines. The “Mag 7” complex remains the factor that matters most, but the grading rubric has tightened: how much incremental revenue comes in per incremental dollar of infrastructure spend—and how clearly management frames the guide.
The setup is clean: Alphabet (GOOGL) and Amazon (AMZN) report this week, and they’re arguably the best “second-look” read-through after last week’s mega-cap prints. Cmind’s model is already showing cluster-level strength in parts of Health Care and Industrials (multiple >90% probabilities), while pockets of small-cap left-tail risk remain in Consumer and Materials—exactly the type of tape that produces spreads > beta.
The key point for systematic readers: the reaction function will trade the guide, not the EPS line.
Feature of the Week
Mag 7: AMZN + GOOGL | AI spend is the “primary driver | Free cash flow is the scoreboard

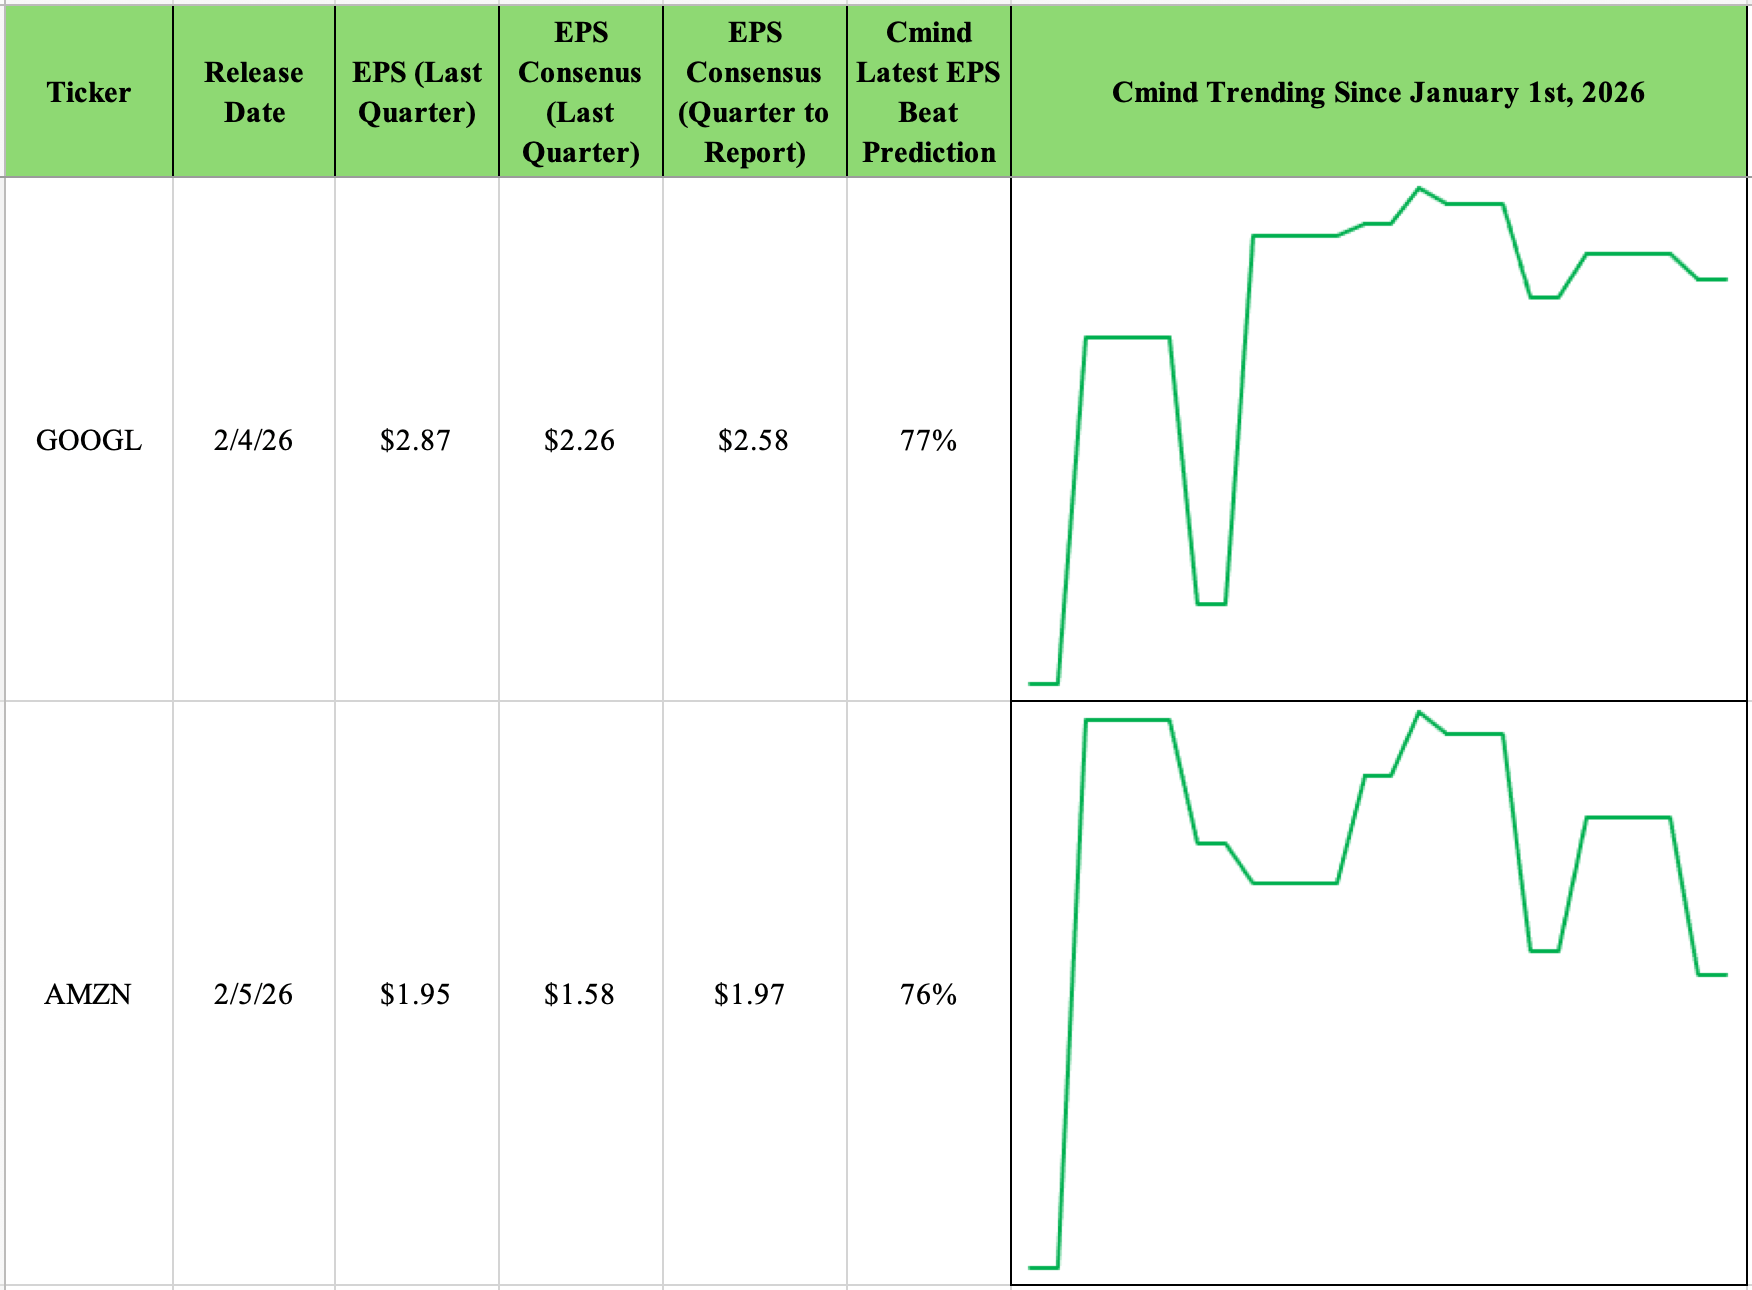
This week’s feature is a tradable cluster with a Mag 7 read-through—anchored by AMZN and GOOGL. The market’s question has shifted from “Who is spending?” to “Who converts spend into durable cash flow—and can explain the payback timelines?” That’s why we frame these prints with a CapEx sensitivity lens (CapEx + CapEx per share) alongside the model’s daily probability path into the event window.
Cmind flags level + daily signal behavior
GOOGL: 77% beat probability into 2/4/26 (post-market). The signal ramps early, dips, then stabilizes—consistent with higher expectations but improving clarity late in the window. Translation: the quarter may be fine, but the guide needs to be clean for the tape to “pay” the print.
AMZN: 76% beat probability into 2/5/26 (post-market). The daily path shows more visible step-changes—typical when the tape is actively repricing cloud demand and margin throughput assumptions. Translation: the tape is recalibrating “what’s real” around AWS growth, AI attach, and cost structure.
Why CapEx can dominate the reaction
CapEx is the market’s AI reality check—because it hits (1) near-term margins via operating leverage decisions and (2) the medium-term free cash flow arc via depreciation, working-capital intensity, and build cadence. In this regime, investors are not just watching “spend”; they’re watching whether management can model into revenue with credible unit economics.
AMZN CapEx (last quarter): $22.62B (CapEx per share: $2.14) FY2026 free cash flow forecast: ~$102.7B (FCF/share: $7.50–$10.00)
GOOGL CapEx (last quarter): $13.06B (CapEx per share: $1.07) FY2026 free cash flow forecast: ~$53B (FCF/share: $7.50–$8.20)
How to read that quickly: AMZN is the higher absolute spend story—so the tape will demand throughput proof (spend → revenue → cash) and will reward any evidence that AI workloads are scaling with improving economics. GOOGL is the expectations-management story—so the tape will punish guidance ambiguity if investors think the demand/AI upside was pulled forward and is now “priced.”
The “what-to-watch” checklist
AI revenue conversion cues: Are they quantifying AI-driven demand (workloads, utilization, attach) or keeping it narrative?
Cloud margin throughput: Any language linking AI growth to improving unit economics tends to compress dispersion; a vague bridge tends to widen it.
CapEx framing (payback timelines): Are they committing to a spend pace with measurable outputs—or widening the range?
Free cash flow credibility: Tone shifts around cash generation can dominate the “beat vs miss” optics.
Expectation risk: Elevated expectations = “good numbers aren’t enough.” The market wants a tighter guide.
Final thoughts here:
GOOGL (ramp → dip → stabilize): the tape flirted with higher expectations, then demanded cleaner evidence; stabilization suggests expectations are set—but the guide has to validate.
AMZN (step-changes): expectations are being repriced in chunks—classic behavior when investors are updating beliefs about AWS demand and margin math in real time.
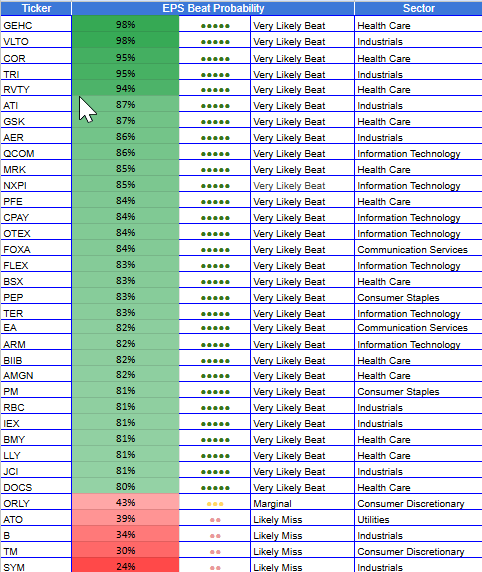
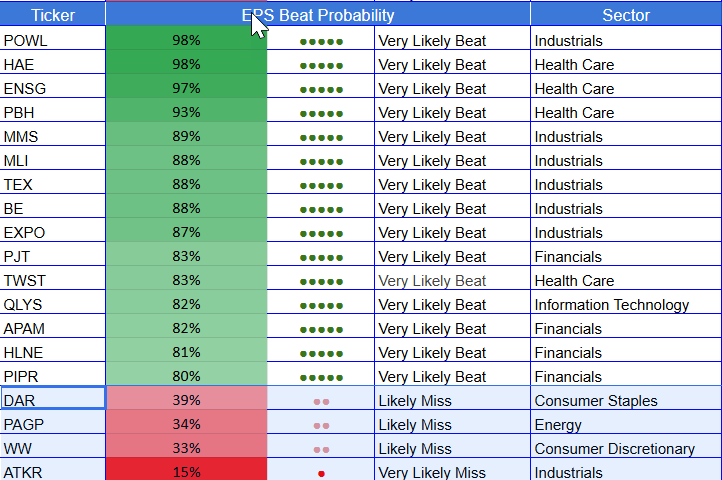
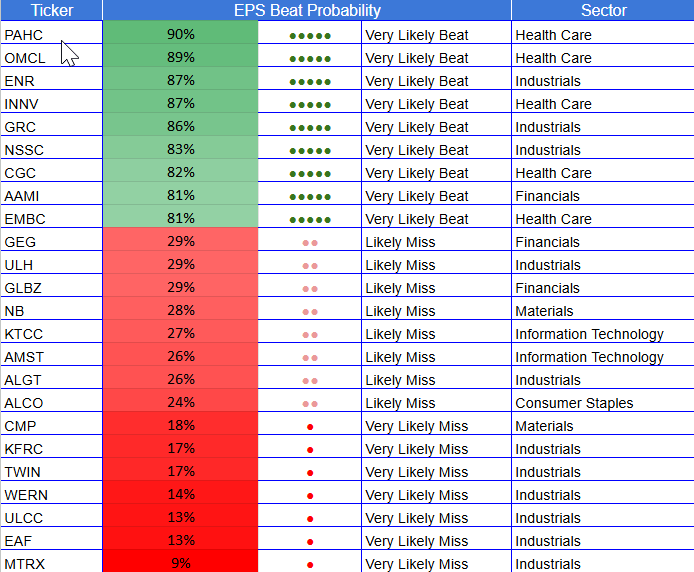
Top 6 Beats / Top 6 Misses - Week of February 2
✅ Top Beats
GEHC — 98% Health Care Large Cap
HAE — 98% Health Care Small Cap
POWL — 98% Industrials Small Cap
VLTO — 98% Industrials Large Cap
ENSG — 97% Health Care Mid Cap
TRI — 95% Industrials Large Cap
⚠️ Top Misses
MTRX — 9% Industrials Small Cap
EAF — 13% Industrials Small Cap
ULCC — 13% Industrials Small Cap
WERN — 14% Industrials Small Cap
AKTR — 15% Industrials Mid Cap
Heatmap
This week’s heatmap shows a two-speed market:
Right-tail density clusters most clearly in Health Care and Industrials, where multiple names are screening >90% simultaneously—often a sign of stronger late-window convergence.
Left-tail risk is more idiosyncratic and concentrated in smaller names, where liquidity + guidance ambiguity can create discontinuous gaps.
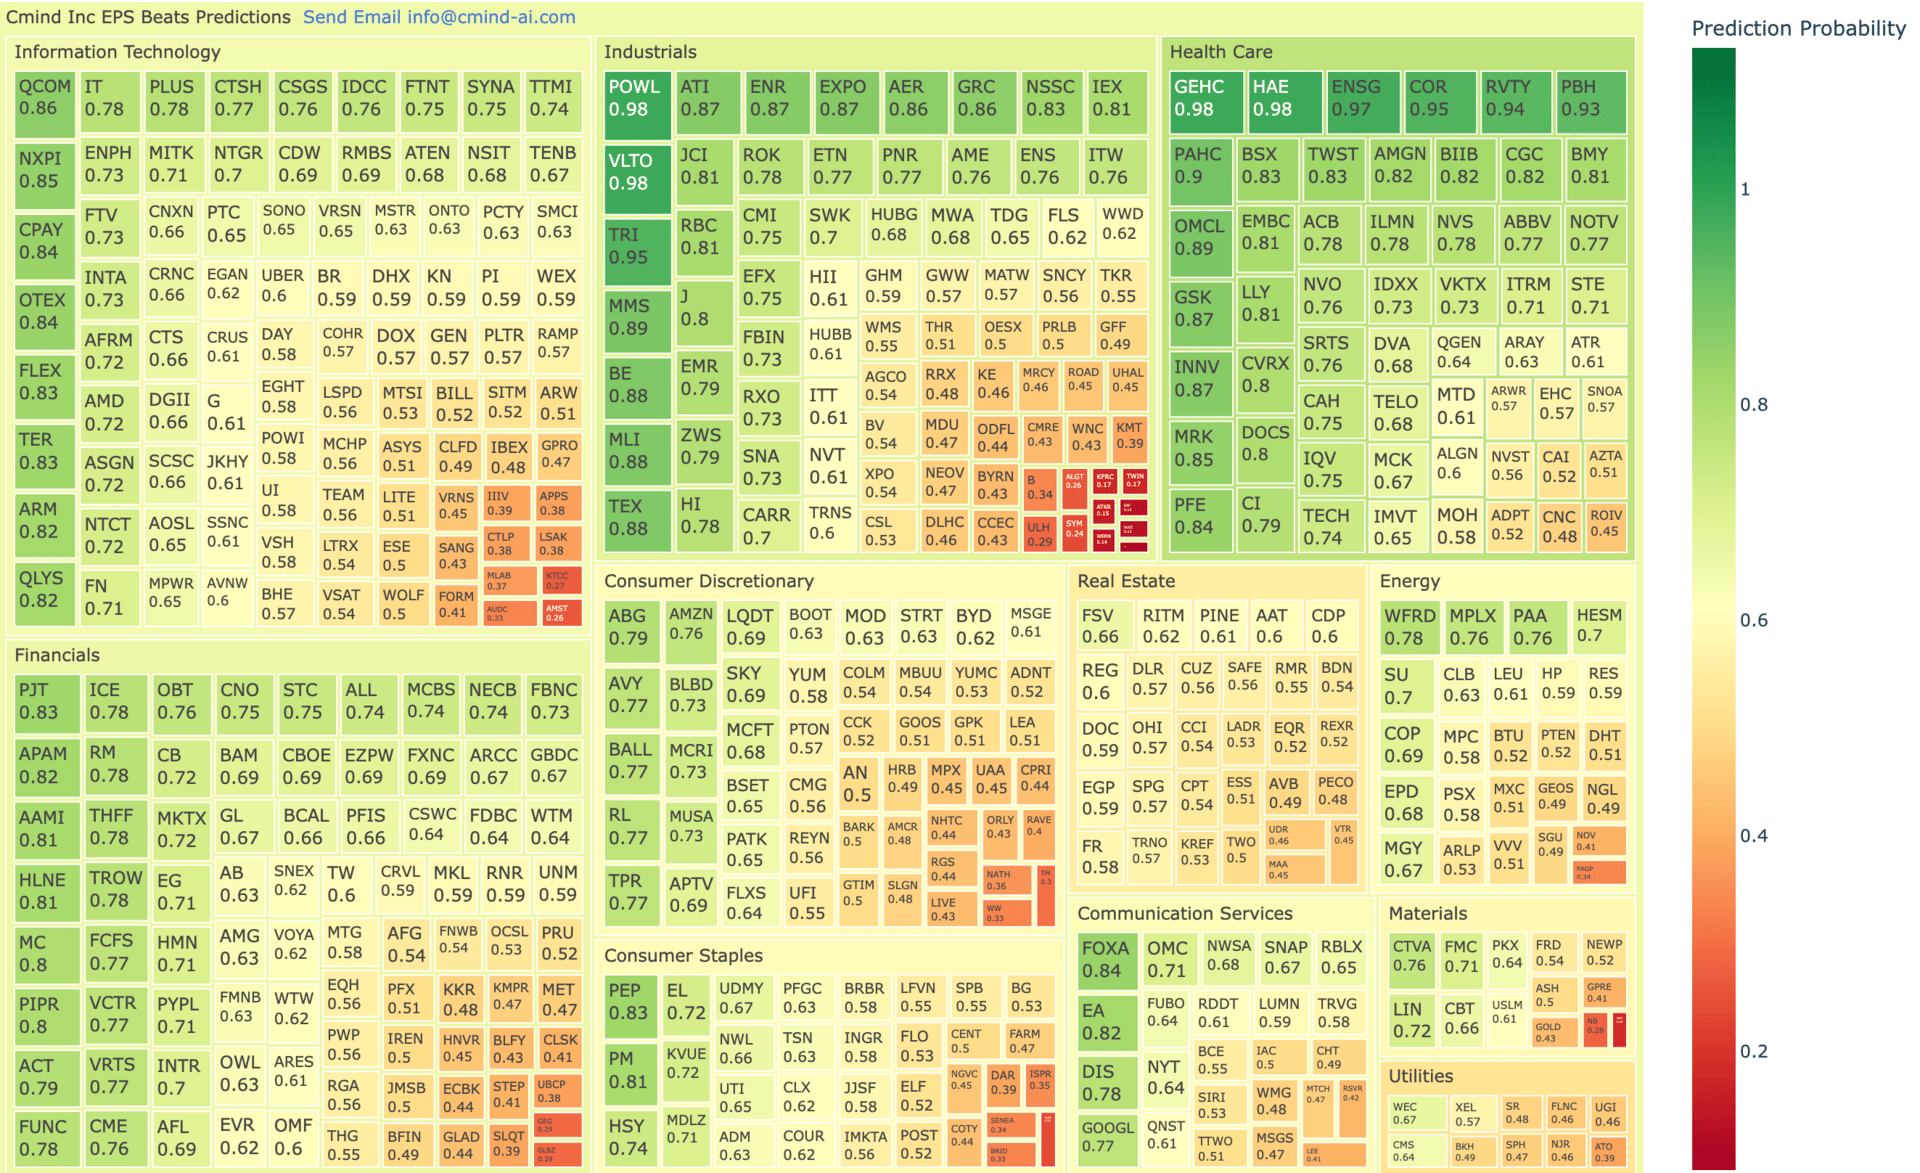
Heatmap by Market Cap exposure
Large caps: The tape is still dominated by mega-cap reaction functions (AMZN/GOOGL). Large-cap probabilities skew constructive overall, but the market is demanding measurable conversion (not just growth).
Mid caps: More balanced distribution—less “factor gravity,” more stock-selection. Mid-cap outcomes often hinge on whether guidance tightens or widens into uncertain demand/expense regimes.
Small caps: Dispersion remains the feature, not the bug. Expect volatility pockets where the print can gap independent of macro, especially in lower-liquidity names screening in the left tail.
Heatmap by sector exposure
Health Care (strongest right tail): Multiple names are screening 90-98%, suggesting the tape is underwriting execution and visibility here.
Industrials (strong and broad): Several high-probability tiles across the sector point to “execution premium” behavior—often supportive for basket construction and relative-value spreads.
Information Technology (selective strength): The sector reads as constructive but not uniform—more selectivity than blanket green.
Consumer / Materials (more left-tail pockets): The weak probabilities here look less like “macro calls” and more like guidance + liquidity risk in smaller names.
Top Movers — Week over Week Prediction Score Shifts (±10 pts)
Change in Cmind EPS Beat probability vs ~1 week ago. This is signal movement, not price movement.
Operationally, we read large upward movers as “confidence ramps” where the tape is underwriting execution, while large downward movers are “fragility flags” where one line of guidance can dominate the quarter’s EPS optics. In weeks like this—movers become a better risk map than sector headlines.
✅ Upward shifts
FRD 6% → 54% (+48) — Materials (Small)
MTRN 4% → 36% (+32) — Industrials (Small)
MITK 9% → 39% (+31) — Info Tech (Small)
XPO 4% → 34% (+30) — Industrials (Mid)
ASUR 16% → 44% (+29) — Info Tech (Small)
WB 11% → 38% (+27) — Comm Svcs (Small)
FLR 13% → 40% (+26) — Industrials (Mid)
GFF 17% → 43% (+26) — Industrials (Small)
PKX 26% → 52% (+26) — Materials (Mid)
BIRD 13% → 38% (+25) — Cons Staples (Small)
TPR 21% → 45% (+24) — Cons Disc (Mid)
DHT 34% → 56% (+22) — Energy (Small)
LEU 45% → 63% (+19) — Energy (Small)
LEVI 49% → 67% (+18) — Cons Disc (Mid)
ATGE 82% → 97% (+15) — Cons Staples (Mid)
IRDM 69% → 83% (+14) — Info Tech (Mid)
PSTG 50% → 64% (+14) — Info Tech (Mid)
⚠️ Downward shifts
ADBE 57% → 23% (-34) — Info Tech (Large)
HYLN 44% → 15% (-29) — Industrials (Small)
SWKS 57% → 29% (-28) — Info Tech (Mid)
MHO 56% → 29% (-27) — Cons Disc (Small)
BMBL 53% → 28% (-25) — Comm Svcs (Small)
TSCO 53% → 28% (-25) — Cons Disc (Mid)
BV 51% → 27% (-24) — Industrials (Small)
MU 58% → 34% (-24) — Info Tech (Large)
MSGS 64% → 42% (-22) — Utilities (Mid)
CHGG 51% → 29% (-22) — Cons Disc (Small)
INCY 70% → 49% (-21) — Health Care (Mid)
GPK 53% → 35% (-18) — Cons Disc (Small)
WAFD 48% → 31% (-17) — Financials (Small)
DX 53% → 36% (-17) — Real Estate (Small)
QRVO 86% → 72% (-14) — Info Tech (Mid)
SXC 71% → 57% (-14) — Materials (Small)
This week’s mover tape is a classic dispersion regime: the largest deltas are concentrated in small/mid-cap single names (FRD +48, MTRN +32, XPO +30) while mega/large-cap tech shows localized left-tail pressure (ADBE -34, MU -24, SWKS -28). That pattern usually means the model is seeing late-window convergence in a handful of idiosyncratic setups, while simultaneously widening caution across parts of the AI/semis software stack.
Two cluster reads matter. Industrials + Materials dominate both tails—big positive flips (FLR, GFF, XPO) alongside sharp negative resets (BV, HYLN, SXC). That mix is exactly where earnings reactions tend to be most “gap-prone”: operating leverage + guide tone can overwhelm the print.
Expect fewer index-level tells and more single-name opportunities, where the score changes help define which names have tightening vs widening pre-print distributions.
Setup for next week
Next week keeps the earnings tape in Mag 7 gravity, but dispersion broadens quickly as more Tech, Health Care, and cyclicals print. The main shift to watch: the market’s grading rubric moves from “AI spend plans” to AI conversion proof + cash flow discipline across the broader universe.
The playbook doesn’t change—only the number of names being tested.
About the Model
Cmind AI’s EPS predictions are powered by a machine learning model built for accuracy, objectivity, transparency, and daily updates with the latest market information. We ingest over 150 variables across five data modalities—including real-time 10-Q filings, earnings transcripts, governance metrics, and peer signals—to provide early, company-specific EPS forecasts.
Our EPS signals update daily across 4,400+ U.S. stocks using a multi-input ML model (filings, transcripts, price/earnings dynamics, governance, and peer signals). The goal isn’t to predict headlines—it’s to quantify where dispersion is most likely so you can build better baskets, hedges, and sizing into catalyst windows.
📩 To learn more, contact us at [email protected]