- Cmind AI by Weihong Zhang
- Posts
- Mag 7 week: MSFT and META are the week’s AI monetization | CapEx discipline litmus tests
Mag 7 week: MSFT and META are the week’s AI monetization | CapEx discipline litmus tests
Where probability is clustering, where it’s breaking, and the Top Movers (+/- 10 pts) driving dispersion | AAPL 91 / MSFT 86 / META 81 / TSLA 55
John DiBenedetto & Weihong Zhang
January 26, 2026
Hi everyone — welcome to this week’s Cmind Earnings Edge.
This is the first true “mega-cap + macro read-through” week of earnings season. When MSFT, META, AAPL and TSLA all print inside the same 48-hour window, the tape stops treating earnings as isolated events and starts pricing regime confirmation: AI spend → revenue conversion, operating leverage vs reinvestment, and whether guidance language tightens (or widens) the forward distribution.
Two reminders for this week’s setup:
The market will trade the reaction function, not the EPS line. High-quality beats can still sell off if guidance introduces uncertainty (CapEx, margins, demand cadence). Conversely, “meets” can rally if the forward bridge is clean and confidence improves.
Dispersion is the product. The heatmap shows a broad right-tail in Financials/Industrials/large-cap Tech—but the left-tail pockets (especially cyclicals and select comms/industrial names) look like volatility traps where thin liquidity can amplify gaps.
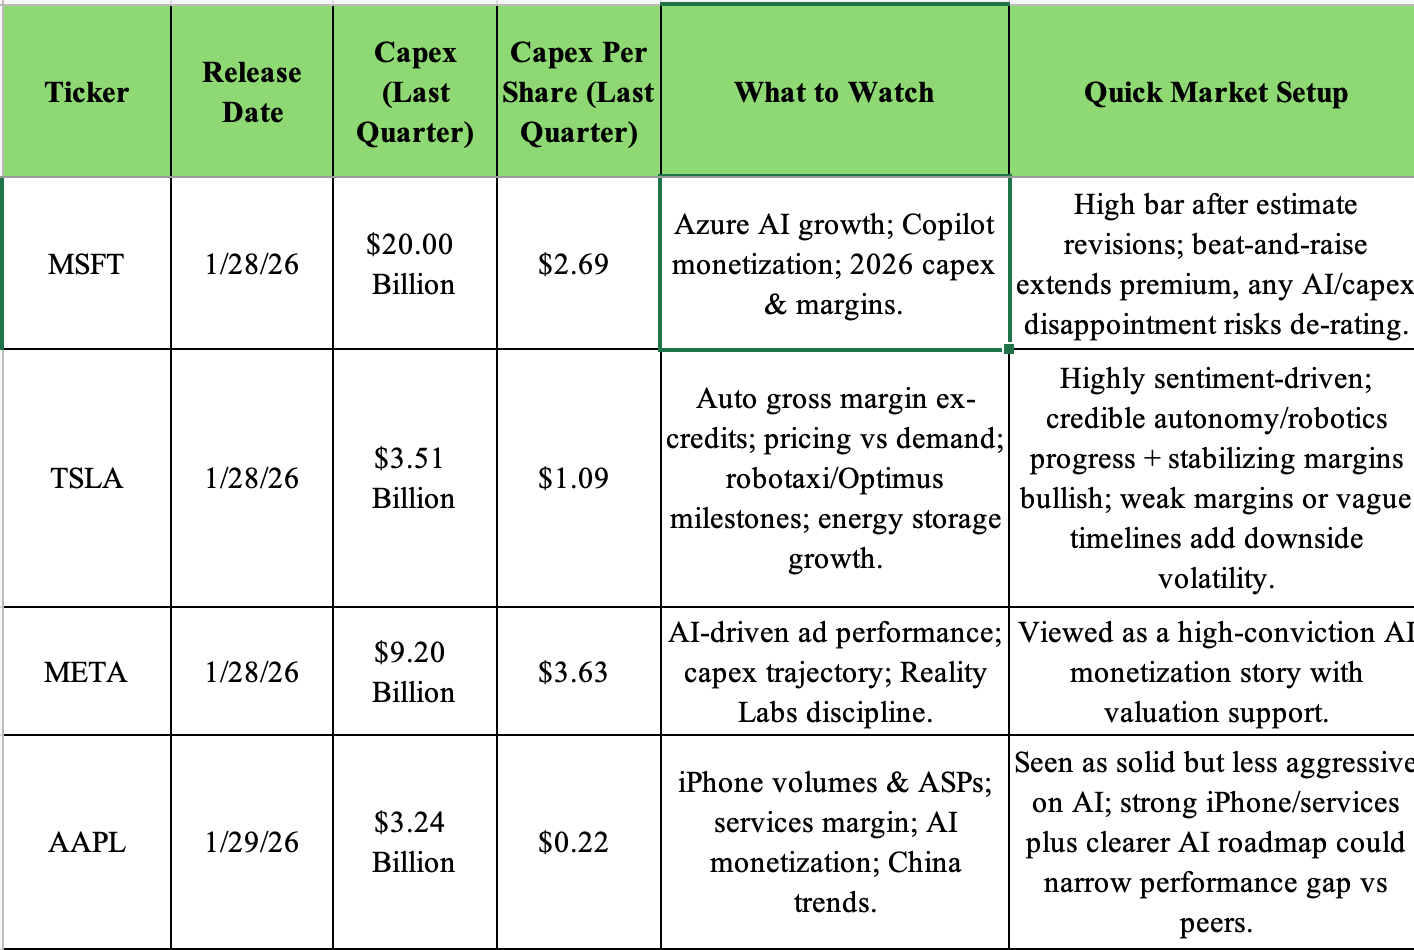
Feature of the Week : The Magnificent 7 — focus on MSFT + META
Earnings season doesn’t start with a print—it starts with a grading rubric. For the last few quarters, “AI exposure” was enough to earn a valuation premium. Now the market is asking a harder question: Is AI monetizing…or just capitalizing? That’s why this week’s Mag 7 mini-cluster matters as a factor trade, not just a single-name event.
This week: MSFT, META, TSLA (1/28) + AAPL (1/29).
Next week: AMZN + GOOGL.
Later: NVDA (2/25).
Cmind’s current beat probabilities put a clean structure around the setup: AAPL 91%, MSFT 86%, META 81%, TSLA 55%. But the important point for positioning is how those probabilities behave over time. That’s why we’re using daily sparklines: they expose whether the signal is stable (confidence compounding) or jumpy (uncertainty unresolved). TSLA’s higher volatility in the daily series maps cleanly to its “two-story” identity right now—an EV business the market can model, and an autonomy/robotaxi narrative the market still struggles to underwrite in revenue terms.

Why CapEx is the axis this week
The fastest way to understand the Mag 7 in 2026 is to treat them as AI infrastructure firms with different monetization clocks. CapEx has become a first-order input into the reaction function because it directly pressures free cash flow and forces management to answer: what’s the payback? Even when EPS beats, the stock can sell off if the CapEx trajectory expands or the ROI bridge gets vaguer. Conversely, a “meet” can rally if management tightens the bridge and improves visibility.
That’s also why the CapEx comparison view matters: it lets investors contextualize whether spend is (a) competitively necessary, (b) accelerating faster than monetization, or (c) stabilizing with improving returns. For sophisticated books, this becomes a position sizing and hedging problem as much as a direction call: high beat probability with high CapEx uncertainty is often a “wins on EPS / trades on guidance” setup.
MSFT (86%): “AI attach rate” vs. margin + CapEx math
Microsoft is the cleanest lens on the monetization clock because Azure is where AI demand should show up in a measurable way.
What the market will trade:
Azure growth + mix: not just the headline growth rate—core cloud vs. AI workloads, and whether AI is pulling forward spend sustainably or creating a timing distortion.
CapEx + margin bridge: does incremental AI revenue translate into improving contribution margin, or does the quarter read as “spend-first, monetize-later”?
Guide language: tight ranges, explicit cadence, and quantified constraints tend to reduce dispersion. “Multi-quarter ramp” language tends to widen it.
META (81%): Ad durability + cost discipline, under a higher CapEx spotlight
Meta is still one of the best “risk-on sentiment” thermometers, but the market’s scoring rubric is now conversion + discipline, not just growth.
What the market will trade:
Ad pricing + engagement quality: monetization that doesn’t degrade engagement.
Opex posture: hiring tone, comp discipline, and how management frames AI infrastructure ROI.
CapEx trajectory clarity: does the company communicate payback windows and measurable outputs, or does it ask investors to underwrite a longer-dated promise?
This is exactly where a CapEx-sensitive attribution layer helps: if a beat is likely, the next question becomes whether CapEx guidance increases reaction risk—even for “correct” EPS calls.
AAPL (91%): Mix, margins, and the clean-guide premium
Apple’s high probability reading matters because the market is still paying for clean bridges: mix stability, margin commentary, and guidance that reduces uncertainty. In this tape, “good numbers” can be neutral if the forward bridge gets messy; “good numbers” plus a clean bridge tends to get paid.
TSLA (55%): High-volatility, guide-dominant setup
TSLA’s marginal probability and higher daily volatility is a feature, not a bug—this is a name where the guide can dominate the print. The market’s not just forecasting EPS; it’s forecasting credibility around the transition: what’s happening in the EV margin stack today, and what timeline is realistic for autonomy-driven revenue tomorrow.
Bottom line: This week is an AI reality-check window. The market is still bullish on the destination—but it’s no longer funding the journey without a CapEx → monetization bridge it can actually model.
Top 6 Beats / Top 6 Misses for Week of January 26, 2026
✅ Top 6 Beats
ATGE — 97% (Consumer Staples, Mid Cap)
EDU — 96% (Consumer Staples, Small Cap)
V — 94% (Financials, Large Cap)
MA — 92% (Financials, Large Cap)
HON — 91% (Industrials, Large Cap)
IBM — 91% (Information Technology, Large Cap)
⚠️ Top 6 Misses
JVA — 6% (Consumer Staples, Small Cap)
LYB — 10% (Materials, Large Cap)
IP — 11% (Materials, Large Cap)
URI — 14% (Industrials, Large Cap)
DOW — 15% (Materials, Large Cap)
CHTR — 17% (Communication Services, Large Cap)
Heatmap

This week’s board is defined by two simultaneous truths:
A large, liquid right-tail (payments, industrial platforms, select mega-cap tech) that creates clean “quality execution” baskets.
A deep left-tail in cyclicals (Materials + pockets of Industrials/Comms) where gap risk is meaningfully higher than the index implies.
Market Cap exposure

Large Cap: The large-cap panel is where the signal looks most “institutional”—a broad green core (payments + industrial bellwethers + mega-cap tech) with a few notable red outliers that can drive index-level surprise risk. The large-cap right tail is led by V (94%), MA (92%), AAPL (89%), HON (91%), IBM (91%), and MSFT (81%)—a setup that typically rewards basket construction over single-name hero trades. Caution flag lives in large-cap cyclicals, so hedges matter.
Mid Cap: Mid caps are mixed—less “clustered,” more name-specific. That’s usually where dispersion converts best into relative value: pairs, factor-neutral spreads, and volatility-aware sizing. Several of this week’s largest probability jumps are mid-cap, which is exactly where late-window signal convergence can create sharp reactions.
Small Cap: Small caps remain the most convex part of the board: the left tail is deeper and the reaction function is less forgiving (liquidity + guidance ambiguity). If you’re playing this bucket, the edge is less about being “right” and more about structuring: sizing, exits, and hedges.
Sector exposure

Financials = execution premium week. The sector shows a clean right-tail led by V/MA, with other large financials screening constructive. This is the classic “macro-sensitive microstructure” sector: rates/curve/credit commentary can spill into broader tape expectations quickly.
Industrials are bifurcating. There’s a strong green core (HON, RTX, LMT, ADP) but also sharp left-tail pockets (URI and select transports/logistics names). This is what dispersion looks like early in earnings season: quality platforms get paid; cyclicals with uncertain cadence get punished.
Information Technology is about monetization + spend math. The board likes parts of large-cap tech (IBM/MSFT) but remains selective across the broader stack. Watch for second-order read-throughs from MSFT/META into software and AI-adjacent names.
Materials are the most fragile cluster on the board. The left tail is dominated by large Materials (LYB, IP, DOW)—exactly the kind of sector where “good quarter” can be overridden by a cautious guide.
Top Movers (±10 pts week over week)
✅ Upward shifts
CVLG: 20% → 66% (+45 pts) — Industrials (Small Cap)
AVT: 29% → 70% (+41 pts) — Information Technology (Mid Cap)
XRX: 13% → 51% (+39 pts) — Information Technology (Small)
CP: 31% → 70% (+38 pts) — Industrials (Large)
BX: 46% → 83% (+37 pts) — Financials (Large)
VZ: 20% → 54% (+35 pts) — Communication Services (Mid)
SBAC: 35% → 69% (+34 pts) — Real Estate (Large)
BKR: 50% → 85% (+35 pts) — Energy (Mid)
PRK: 46% → 79% (+33 pts) — Financials (Mid)
AMP: 37% → 70% (+33 pts) — Financials (Large)
⚠️ Downward shifts
T: 81% → 38% (-43 pts) — Communication Services (Large)
CHTR: 51% → 17% (-35 pts) — Communication Services (Large)
URI: 45% → 14% (-32 pts) — Industrials (Large)
MRTN: 68% → 39% (-29 pts) — Industrials (Small)
LII: 85% → 56% (-29 pts) — Industrials (Large)
BA: 52% → 24% (-29 pts) — Industrials (Large)
JBHT: 51% → 27% (-24 pts) — Industrials (Large)
EXPD: 53% → 29% (-24 pts) — Industrials (Large)
UHS: 45% → 23% (-22 pts) — Health Care (Mid)
TLRY: 51% → 30% (-22 pts) — Health Care (Small)
Commentary on Top Movers
The mover tape this week is telling a very specific story: dispersion is re-pricing forward confidence, not backward results. The biggest positive jumps cluster in names that moved from “coin-flip” to “tradable right-tail” in a single week (e.g., BX +37, CP +38, BKR +35). That kind of late-window lift usually signals model convergence across pre-print features—often the difference between a name being “watchlisted” versus being basket-eligible.
On the downside, the largest drops are concentrated in Communication Services + Industrials (e.g., T -43, CHTR -35, URI -32, plus transport/logistics), which is exactly where guide language can dominate the reaction function. Practically: when a large-cap name falls 30–40 points in a week, the market is often pricing uncertainty—either around demand cadence, margin bridge, or visibility. In a week dominated by mega-cap tech and high-profile industrial prints, these downside movers can become volatility pockets that gap independently of the index.
Set up for next week
Next week is where earnings season typically shifts from “cluster week” to breadth week. The calendar expands, sector breadth increases, and the market starts building a clearer cross-asset map: which sectors have operating leverage, which are still fighting margin compression, and where guidance credibility is breaking down. If this week is about MSFT/META/AAPL setting the AI monetization rubric, next week is where that rubric gets applied across the broader tape—software, cyclicals, and consumer-linked names—often with sharper dispersion and faster factor rotation.
About the Model
Cmind AI’s EPS predictions are powered by a machine learning model built for accuracy, objectivity, transparency, and daily updates with the latest market information. We ingest over 150 variables across five data modalities—including real-time 10-Q filings, earnings transcripts, governance metrics, and peer signals—to provide early, company-specific EPS forecasts.
Our EPS signals update daily across 4,400+ U.S. stocks using a multi-input ML model (filings, transcripts, price/earnings dynamics, governance, and peer signals). The goal isn’t to predict headlines—it’s to quantify where dispersion is most likely so you can build better baskets, hedges, and sizing into catalyst windows.
📩 To learn more, contact us at [email protected]