- Cmind AI by Weihong Zhang
- Posts
- Mag7 Earnings Week: Strong Beat Odds with AMZN, AAPL, MSFT, GOOGL, META; Forecast Capex Numbers Revealed
Mag7 Earnings Week: Strong Beat Odds with AMZN, AAPL, MSFT, GOOGL, META; Forecast Capex Numbers Revealed
Top Beat/Miss Signals: V, TMUS, AMZN Lead; PDS, SBUX, LYB at Risk | Do Investors Reward or Punish the $570B AI Capex Spend? | Top Movers
Weihong Zhang
April 27, 2026
Cmind Earnings Update - April 27 – May 2, 2026
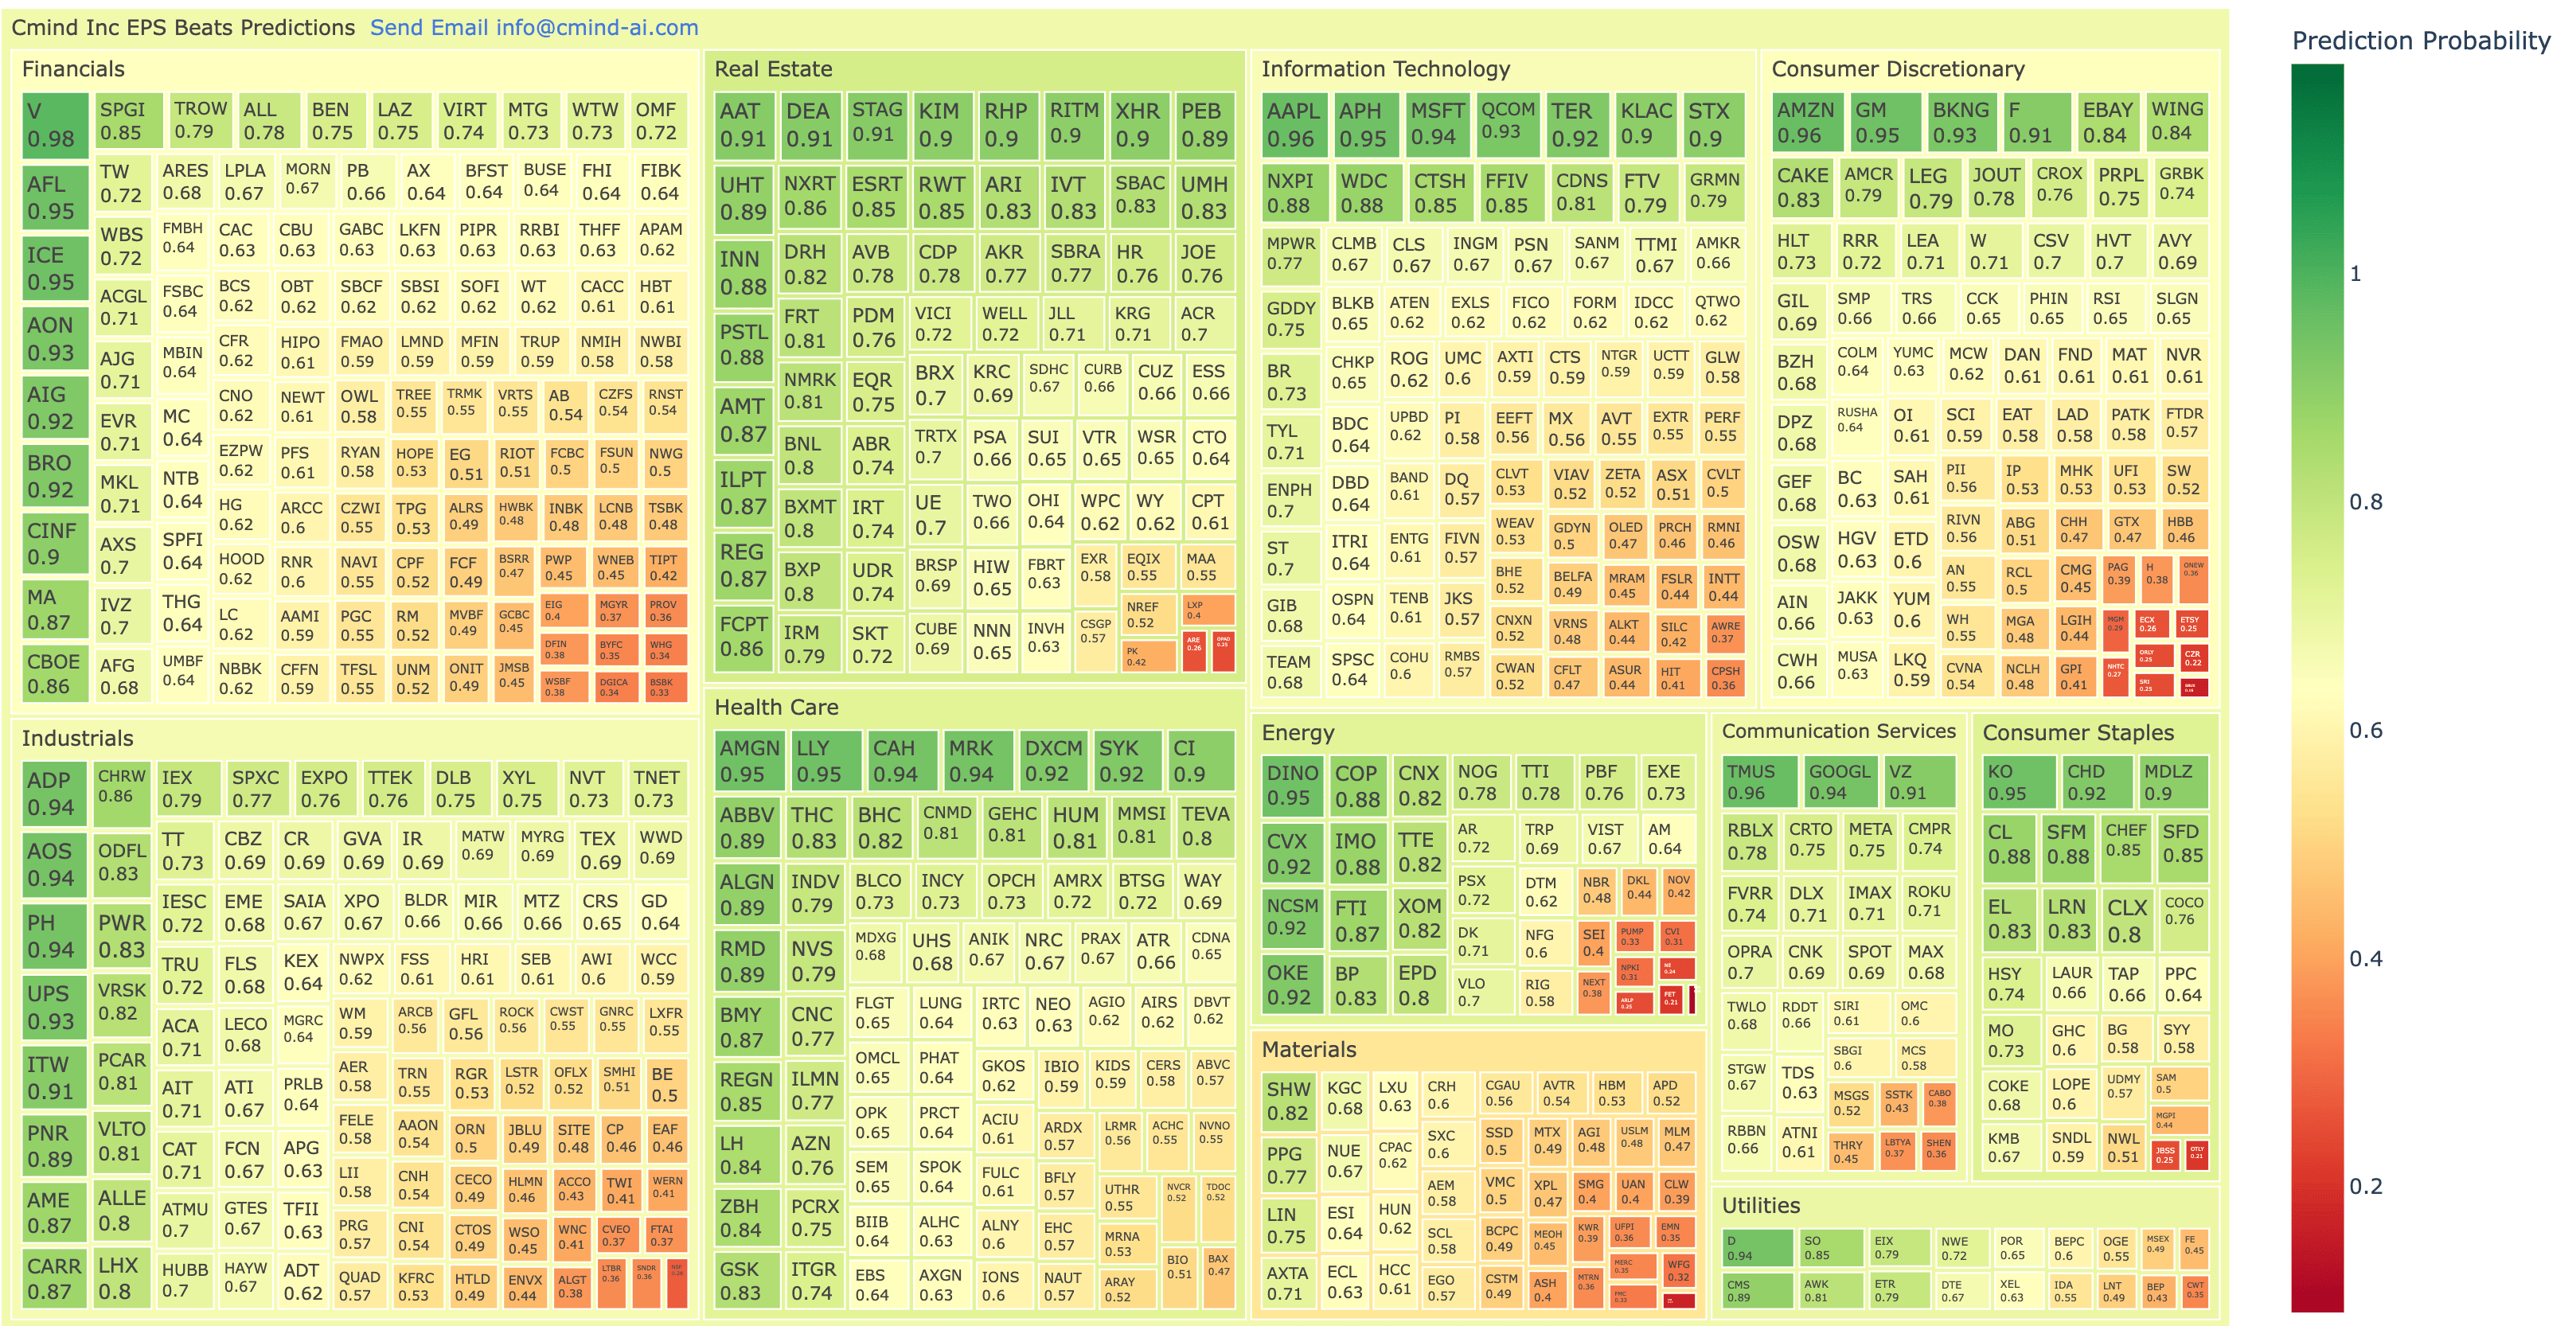
This week is one of the highest-density earnings weeks of the quarter, with 727 companies in the Cmind EPS Beats Predictor release window from April 27 through May 1. The heatmap is broadly constructive at the index-leadership level, but not uniformly bullish. The strongest green remains concentrated in mega-cap and higher-quality large-cap names, while the red pockets are clustered in Materials, select Consumer Discretionary names, smaller-cap Energy, and idiosyncratic small-cap balance-sheet risk.
Across the full weekly universe, Cmind’s average beat probability is approximately 63.7%, with a median near 63.6%. Roughly 229 companies screen above 70%, and 122 screen above 80%, creating a deep long-candidate pool. On the downside, only 52 companies screen below 40%, but several of those misses are concentrated in tradable areas: restaurants/consumer demand, commodity-linked cyclicals, smaller Energy services, and Materials.
The setup is not “everything is green.” It is a classic dispersion week. The model is favoring operating scale, margin durability, capex-linked infrastructure beneficiaries, and cash-flow resilience. It is penalizing companies where consensus may still be too optimistic relative to margin pressure, inventory/capital intensity, or weaker sentiment vectors.
Feature of the Week: Mag7 Capex Forecast
This week’s most important earnings cluster is the intersection of Mag7 results, AI infrastructure capex, and Cmind’s beat probabilities.
Four major platform companies report on April 29 after the close: Microsoft, Alphabet, Meta, and Amazon. Apple follows on April 30. Cmind’s model is broadly constructive across the group:
AMZN: 96.0% beat probability; consensus EPS $1.61
AAPL: 95.6%; consensus EPS $1.91
MSFT: 94.4%; consensus EPS $4.07
GOOGL: 93.6%; consensus EPS $2.63
META: 75.1%; consensus EPS $6.71
The headline is simple: Cmind is not flagging a broad Mag7 EPS problem. The more important question is whether investors reward the print if capex keeps moving higher.
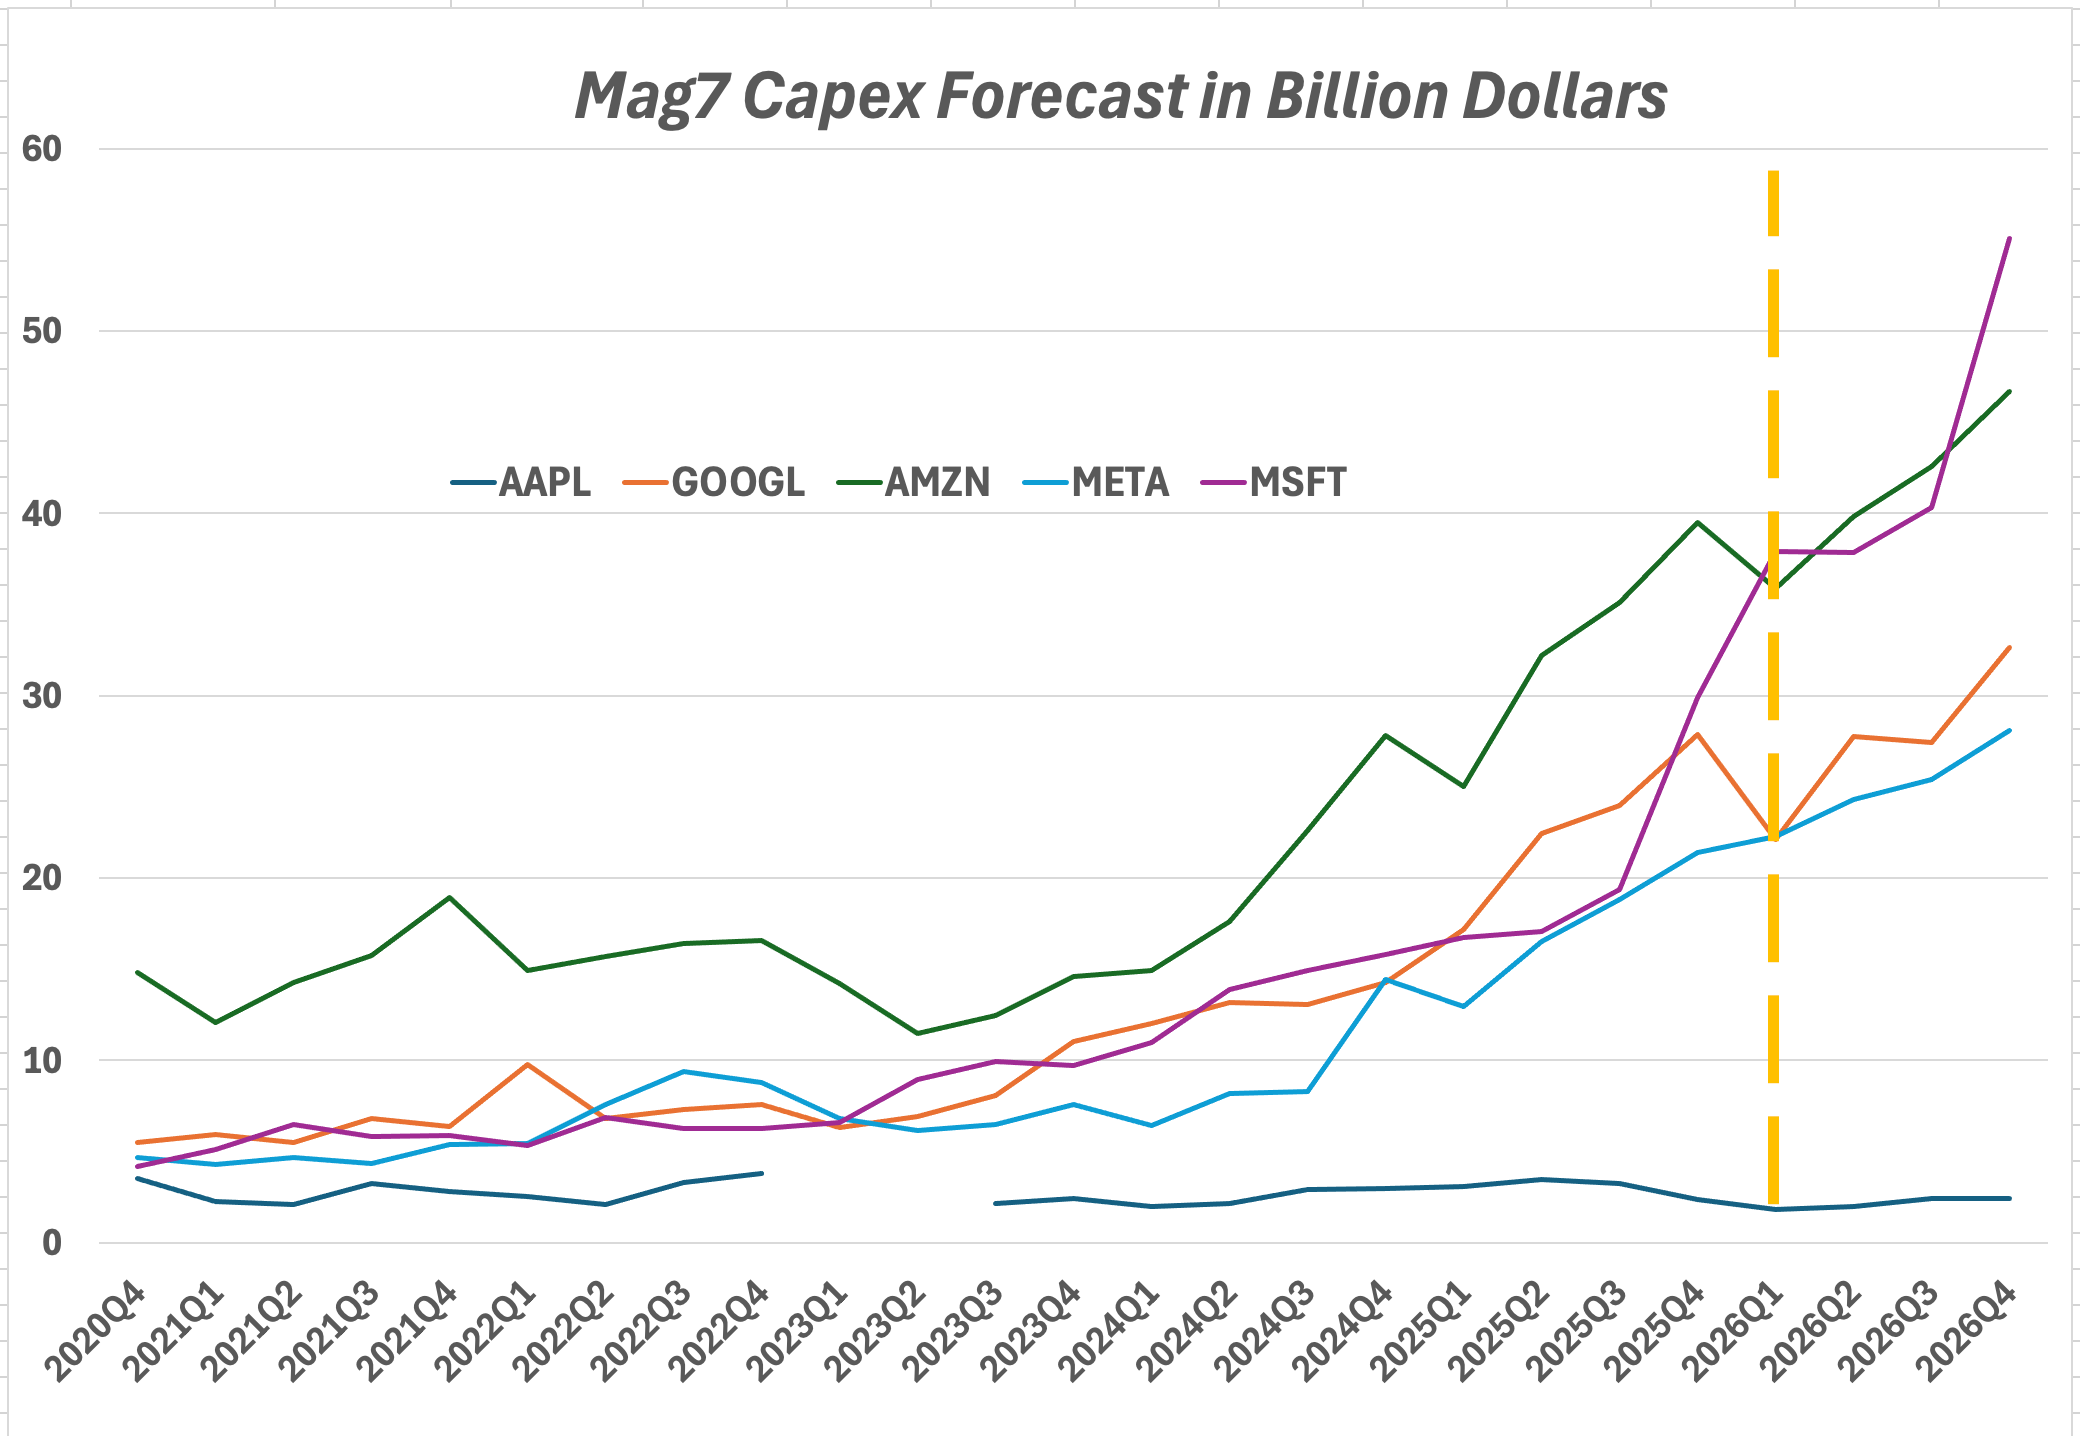
The Cmind capex forecast above shows why this matters. MAG7-related capex has effectively re-based from a cyclical spending line into a structural industry. From CY21 through CY25, cumulative capex across the core platform complex crossed the roughly $1.1 trillion zone. The blended 2026 forecast is tracking near $570 billion in one year, more than the 2021–2023 period combined.
This is no longer just an operating expense or a growth investment. It is one of the largest corporate capital-allocation themes in the market.
The hyperscaler bucket is also not homogeneous. Amazon remains the scale leader and continues to operate from the largest infrastructure base. Microsoft is the fastest compounder and has the clearest enterprise AI monetization narrative, but its capex line is increasingly central to the stock’s reaction function. Alphabet looks like the smoother grower, with a more balanced capex trajectory. Meta is the most volatile from a free-cash-flow perspective because its AI and infrastructure investment is being funded out of Family-of-Apps cash flow, while the return profile is still more debated.
That distinction matters for trading the week. A strong EPS print may not be enough if the market decides that incremental capex intensity is dilutive to near-term FCF. In that framework, META’s 75% beat probability is still positive, but materially less dominant than AMZN, MSFT, and GOOGL. It may be the name where the print-versus-spend debate matters most.
Apple is a different case. AAPL screens strongly on EPS beat probability in the attached data, but it should not be grouped with the same hyperscaler capex thesis. Apple’s full-year capex profile remains much smaller than the cloud infrastructure platforms. In this earnings week, AAPL is more about product demand, margins, services, and China/upgrade-cycle interpretation than whether the AI capex supercycle is accelerating.
The cleanest second-order read-through remains NVDA, even though NVDA is not the earnings event this week. NVDA’s own capex is small relative to the hyperscaler spend curve. The hyperscalers’ capex is effectively NVDA’s revenue opportunity. For investors structuring the AI infrastructure trade, the question is less “which Mag7 company spends the most?” and more “which capex dollars convert into durable revenue, margin, and utilization?”
The tactical takeaway: Cmind’s model sees strong EPS beat odds across the platform complex, but the market reaction may be driven by capex guidance, not just EPS surprise. This is a week where the beat/miss signal should be paired with a capex-sensitivity lens.
HEATMAP
Market-Cap Breakdown:
Mega-Cap Strength, Small-Cap Dispersion
The market-cap cut is the cleanest read on this week’s board.
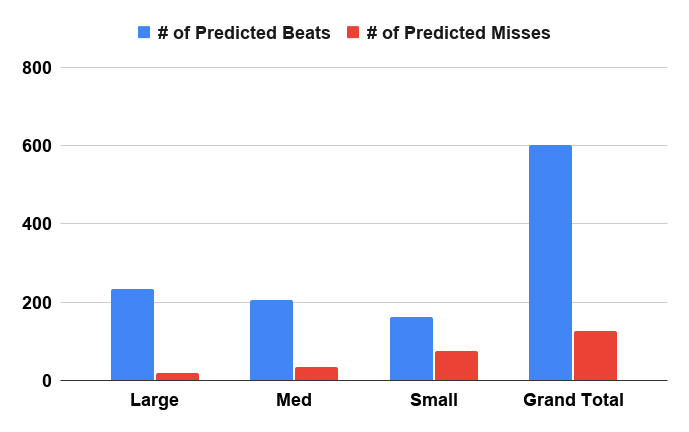
Mega-cap remains the dominant positive cohort. The 16 mega-cap names in this week’s release set carry an average beat probability of approximately 89.6%, with every name above 70% and more than 80% of the cohort above 80%. This is where the model is most constructive: Visa, Amazon, Apple, Microsoft, Alphabet, Coca-Cola, Lilly, Chevron, and other large platform or global-scale names remain heavily green.
Large caps also screen well, with an average probability near 70.7% and more than half the group above 70%. The large-cap board is not risk-free, however. Starbucks, O’Reilly, Alexandria Real Estate Equities, and LyondellBasell show that the model is still flagging downside where operating momentum, pricing, or sector backdrop may not support consensus.
Mid-cap is balanced but selective. The mid-cap cohort has an average beat probability near 62.1%, with strong signals in names such as DINO, STAG, AOS, RITM, and OKE, but meaningful risk in CZR, ETSY, ARLP, FMC, and NSP.
Small caps remain the widest dispersion bucket. The average small-cap probability is only 56.6%, with more red and orange pockets than in mega/large. There are standout positive names, including NCSM, DEA, AAT, UHT, PSTL, and ILPT, but the miss-risk tail is much fatter. PDS, OTLY, FET, OPAD, SRI, JBSS, and several small consumer/energy names screen as downside candidates.
The market-cap takeaway: the model favors scale, but the alpha is in the spread. Mega-cap strength is clear, but small- and mid-cap dispersion offers the better long/short opportunity set.
Sector Breakdown:
Real Estate and Health Care Lead; Materials Carries the Most Risk
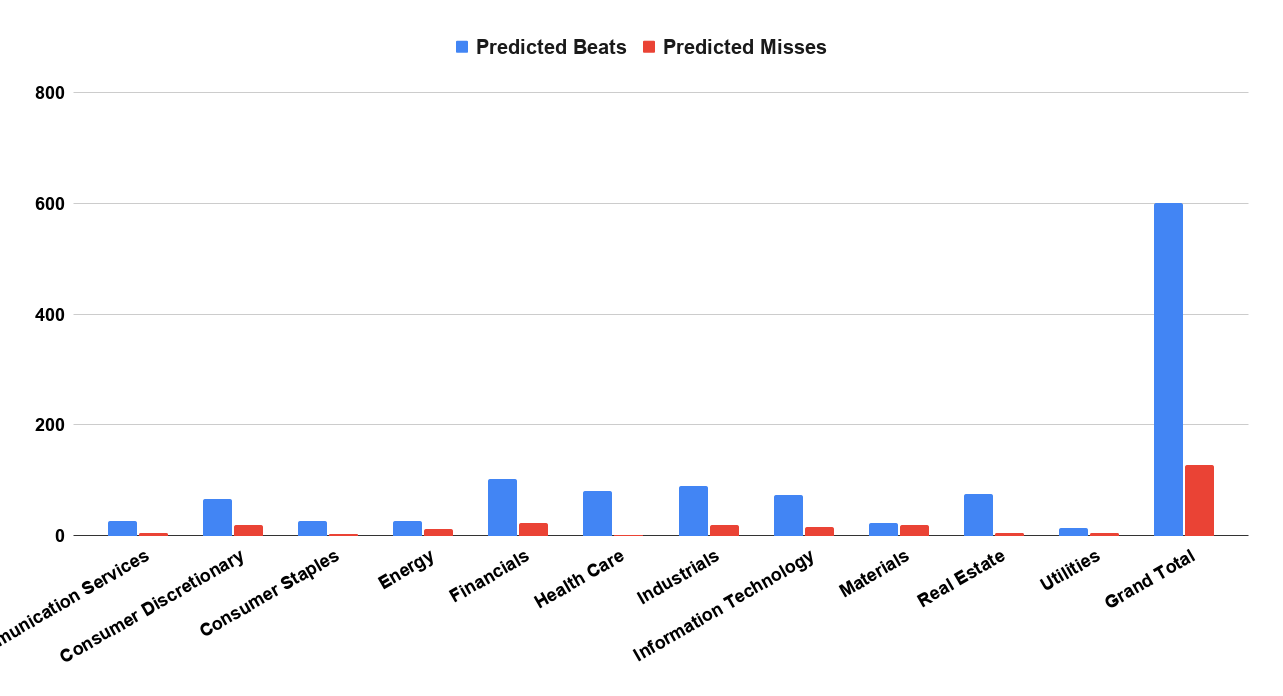
Real Estate is the strongest sector by average probability, at roughly 72.7%, which is notable given the sector’s rate sensitivity. The green cluster includes STAG, DEA, AAT, KIM, RITM, UHT, BXMT, FCPT, and ILPT. The model appears to be distinguishing between operating stability and rate-driven sentiment. That said, not all REITs screen well. ARE and OPAD sit in the red zone and should be treated as company-specific risk cases rather than broad sector calls.
Health Care is also constructive, with an average probability near 69.8%. The leadership is concentrated in larger, higher-quality names: AMGN, LLY, MRK, CAH, DXCM, SYK, CI, and ABBV. Health Care’s green profile suggests the model sees a combination of margin support, durable demand, and less macro sensitivity than cyclical sectors.
Consumer Staples screens positively overall, led by KO, CHD, MDLZ, SFM, and CL. However, the lower end of Staples is not healthy. OTLY and JBSS are clear miss-risk names, showing that the model is rewarding brand scale and punishing weaker operating structures.
Energy is bifurcated. DINO, OKE, CVX, IMO, CNX, and COP show strong beat signals, while PDS, FET, ARLP, CVI, and NPKI are red or orange. This is not a simple oil-and-gas call; it is a company-specific signal around margins, balance sheet, capital intensity, and EPS elasticity.
Information Technology has strong top-end signals, but the sector average is pulled down by smaller-cap and hardware/software names with weaker risk profiles. AAPL, APH, MSFT, QCOM, TER, KLAC, STX, and NXPI screen well. The lower end includes CPSH, AWRE, HIT, SILC, and ALKT.
Consumer Discretionary and Materials are the primary risk zones. AMZN, GM, BKNG, Ford, and eBay are strong, but SBUX, CZR, ETSY, ORLY, MGM, SRI, and several smaller names show downside. Materials is the weakest sector on the board, with an average probability near 51.8%. LYB, FMC, WFG, EMN, MERC, and KWR are the names most worth watching for downside surprise or guidance risk.
Top Beats/Misses for Week of April 27, 2026
Top 6 Beats
Ticker | Company | Date | Market Cap | Sector | Beat Probability |
V | Visa | Apr. 28 AMC | $676.9B | Financials | 97.5% |
TMUS | T-Mobile US | Apr. 28 AMC | $258.0B | Communication Services | 96.3% |
AMZN | Amazon | Apr. 29 AMC | $2.40T | Consumer Discretionary | 96.0% |
AAPL | Apple | Apr. 30 AMC | $3.15T | Information Technology | 95.6% |
APH | Amphenol | Apr. 29 BMO | $125.0B | Information Technology | 95.4% |
AMGN | Amgen | Apr. 30 AMC | $158.5B | Health Care | 95.2% |
Top 6 Misses
Ticker | Company | Date | Market Cap | Sector | Beat Probability |
PDS | Precision Drilling | Apr. 29 AMC | $1.0B | Energy | 9.1% |
SBUX | Starbucks | Apr. 28 AMC | $106.6B | Consumer Discretionary | 16.1% |
LYB | LyondellBasell | May 1 BMO | $20.3B | Materials | 17.1% |
OTLY | Oatly | Apr. 29 BMO | $0.4B | Consumer Staples | 21.0% |
FET | Forum Energy Tech | Apr. 30 AMC | $0.2B | Energy | 21.4% |
CZR | Caesars Entertainment | Apr. 28 AMC | $6.2B | Consumer Discretionary | 22.2% |
Top Movers to Watch: Largest Score Shifts
Point moves represent changes in Cmind beat probability from the prior listed score to the current weekly score.
✅ Upward Movers
D — Dominion Energy | Utilities / Large Cap
41.3% → 93.8% (+52.4 pts)
One of the sharpest upgrades on the board. The move appears tied to improved asset/capex efficiency signals, stronger profitability ratios, and more favorable CFO/analyst sentiment inputs.
OKE — ONEOK | Energy / Large Cap
42.5% → 92.2% (+49.7 pts)
The model moved decisively positive, with drivers pointing to fixed-asset/capitalized-expense efficiency, cash-to-operating-profit support, and improved management/analyst tone.
JOUT — Johnson Outdoors | Consumer Discretionary / Small Cap
34.5% → 78.5% (+43.9 pts)
A notable small-cap discretionary upgrade. The signal appears linked to analyst bullishness, cash/operating profit, and management-language variables.
DAN — Dana Inc. | Consumer Discretionary / Mid Cap
17.1% → 60.8% (+43.7 pts)
The score moved from miss-risk territory to marginally constructive. Key inputs include analyst bullishness, CFO tone, gross-margin change, and EBT/equity factors.
AWK — American Water Works | Utilities / Large Cap
40.3% → 81.3% (+41.0 pts)
Another Utilities name moving sharply higher. The model is picking up stronger profitability quality, analyst sentiment, CFO sentiment, and capital-efficiency factors.
MSFT — Microsoft | Information Technology / Mega Cap
54.0% → 94.4% (+40.4 pts)
The move is especially important given this week’s Mag7 capex theme. The upgrade reflects stronger operating-profit metrics, fixed-asset/capex efficiency, and positive CFO/analyst sentiment changes.
⚠️ Downward Movers
ETSY — Etsy | Consumer Discretionary / Mid Cap
66.7% → 24.8% (-41.9 pts)
The model moved sharply into miss-risk territory, with pressure tied to profitability ratios, gross-margin change, and weakening sentiment-related inputs.
SBUX — Starbucks | Consumer Discretionary / Large Cap
55.4% → 16.1% (-39.3 pts)
The cleanest large-cap downside mover this week. Inventory ratios, gross-margin pressure, receivables risk, and analyst/management tone appear to be weighing on the signal.
FET — Forum Energy Technologies | Energy / Small Cap
60.6% → 21.4% (-39.2 pts)
The downgrade reflects a more fragile Energy services setup, with pressure from inventory intensity, cash/operating profit, EBT/fixed assets, and capital-efficiency variables.
LBTYA — Liberty Global | Communication Services / Mid Cap
74.6% → 37.0% (-37.6 pts)
A major reversal from likely-beat to risk zone. The model is flagging cash/operating profit, capitalized-expense efficiency, and CFO tone/evasiveness variables.
PDS — Precision Drilling | Energy / Small Cap
45.9% → 9.1% (-36.9 pts)
Now one of the lowest-probability names on the board. The downgrade is tied to weaker profitability versus asset base, cash/operating profit, and CFO/analyst bullishness factors.
ARLP — Alliance Resource Partners | Energy / Mid Cap
60.9% → 25.3% (-35.6 pts)
The score break points to deteriorating inventory/current asset signals, cash/operating profit pressure, gross-margin change, and weakening analyst-bullishness inputs.
The most actionable movement is not only in the highest and lowest absolute probabilities, but in the names where Cmind’s model changed direction quickly. This week’s mover list shows sharp upward revisions in Utilities, large-cap Energy, and MSFT, while downside revisions cluster in Consumer Discretionary and smaller-cap Energy.
Closing
This week’s board is constructive, but not complacent. Mega-cap earnings leadership remains strong, and Cmind’s model is signaling high beat probabilities across several of the most important market-cap leaders. But the more interesting opportunity is dispersion: long high-quality mega/large-cap beat candidates, short or hedge against red-zone cyclicals and consumer names, and monitor score movers where the model has changed its mind quickly.
About the Model
Cmind AI’s EPS predictions are powered by a machine learning model built for accuracy, objectivity, transparency, and daily updates with the latest market information. We ingest over 150 variables across five data modalities—including real-time 10-Q filings, earnings transcripts, governance metrics, and peer signals—to provide early, company-specific EPS forecasts.
Our EPS signals are updated daily across 4,400+ U.S. stocks using a multi-input ML model (filings, transcripts, price-to-earnings dynamics, governance, and peer signals). The goal isn’t to predict headlines—it’s to quantify where dispersion is most likely so you can build better baskets, hedges, and sizing into catalyst windows.
📩 To learn more, contact us at [email protected].