- Cmind AI by Weihong Zhang
- Posts
- MU Earnings: AI demand is priced — revenue quality is the edge | Week’s cleanest signals: TME 96%, CWCO 93%, IHS 93%
MU Earnings: AI demand is priced — revenue quality is the edge | Week’s cleanest signals: TME 96%, CWCO 93%, IHS 93%
Utilities are a barbell: 93% beats vs 1–9% miss risk | Power/water and AI load = the hidden CapEx beneficiaries | Top Movers
John DiBenedetto & Weihong Zhang
March 16, 2026
Welcome to this week’s Cmind Earnings Outlook.
This is a dispersion-first week. The calendar is still small-cap heavy (the left tail is overwhelmingly micro-cap), which means index-level “calm” can mask single-name gap risk—especially in thin liquidity and guidance-sensitive sectors. The heatmap is doing what it’s built to do: highlight where the distribution is tightening versus where fragility is compounding.
The meta-rubric remains consistent: the tape is rewarding clean bridges and punishing range widening and “narrative-only” forward commentary.
Feature of the Week — Micron (MU): revenue quality signals inside the AI memory upcycle
Earnings: Thu, Mar 19 (after close)
Consensus EPS: $4.14
Why it’s on the tape: MU sits at the center of the AI infrastructure stack where HBM demand, pricing power, and supply discipline can swing the whole semi complex. But this print isn’t just “memory pricing.” MU is also a clean read-through on hyperscaler/AI spend conversion—because the quality of that revenue shows up quickly in working capital behavior.
Why MU’s release is important (beyond MU)
AI cycle barometer (HBM + leading-edge DRAM): MU’s commentary is one of the fastest ways to validate whether the AI capex wave is translating into real, collected revenue versus optimistic backlog narratives elsewhere in semis.
Microstructure for the complex: MU can reset the reaction function for semis/networking names—especially on guide language (supply tightness, allocation, mix, and margin-throughput).
Cash conversion “sanity check”: In an environment where investors are increasingly skeptical of “spend now, monetize later,” MU is a useful cash/collections lens on the AI demand chain.
What investors will look at in the MU release
Most people will headline revenue / EPS / guide. The sharper read is what explains the numbers:
1) Mix + pricing + supply discipline
HBM mix (how much of growth is high-value AI memory versus broader DRAM/NAND normalization).
Pricing and contract commentary (tight supply language vs easing / competitive concessions).
Bit shipments vs ASP (is growth volume-led, price-led, or mix-led).
2) Margin-throughput and operating leverage
Whether management frames margin durability as structural (mix, yields, supply allocation) versus cyclical (spot pricing).
Any signs of cost creep (manufacturing costs, expedited supply chain, mix dilution).
3) CapEx + capacity adds
Not just the size of CapEx, but how they frame payback: capacity timing, yield ramps, and whether they’re building ahead of confirmed demand.
CapEx language that is too elastic tends to widen dispersion for memory names.
4) Revenue recognition quality signals
This is where MU looks clean today—and it matters because weak cycles often show up first in receivables/collections.
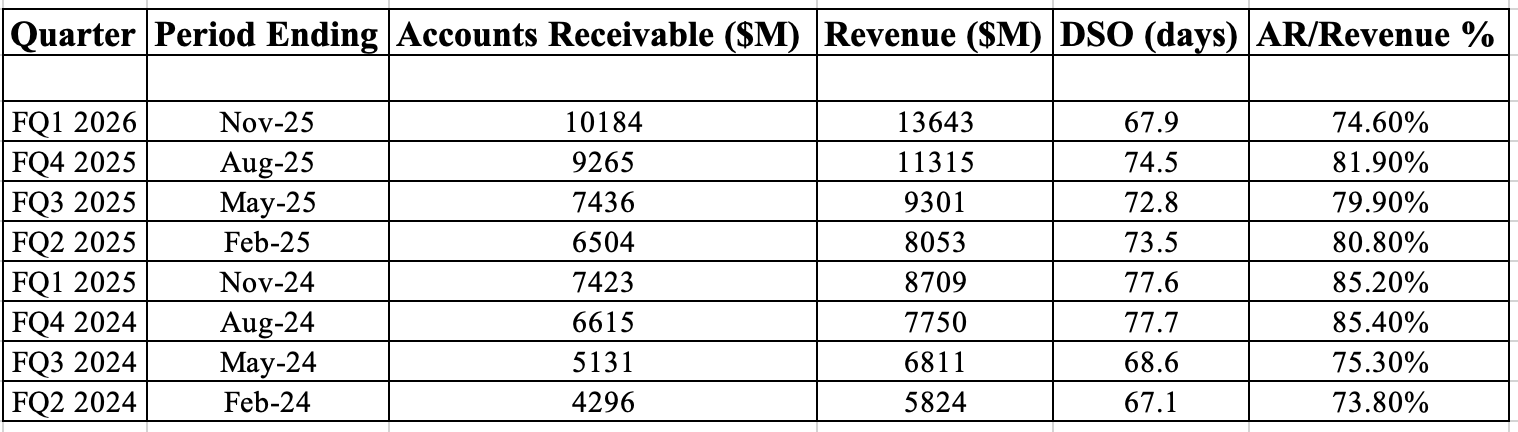
Using the summary table:
DSO improved materially: from 77.6 days (FQ1’25) to 67.9 days (FQ1’26) — a ~9.7-day improvement even as revenue accelerated.
AR/Revenue ratio is trending down: from the ~85% range (mid-2024 / early-2025) to 74.6% in the latest quarter—meaning revenue is scaling faster than receivables.
AR is growing slower than revenue YoY: AR +37% YoY (7,423 → 10,184) versus Revenue +57% YoY (8,709 → 13,643). That’s typically what you want to see in a real demand pull, not a channel push.
Bottom line on quality: No red flags. Collections are improving during a major growth leg, which is consistent with higher-quality customers paying promptly and with demand that’s not being “manufactured” via loose terms.
How to interpret the AR/DSO signal in this cycle
AR/DSO isn’t a “value investor” footnote—it’s a risk-control input.
In frothy upcycles, aggressive revenue often arrives with rising DSO (terms stretch) and AR outrunning revenue (distribution needs help).
MU is showing the opposite: collections tightening while revenue accelerates. That’s a bullish “revenue quality” confirmation—especially plausible if AI-linked customers are strategic buyers with strong balance sheets and limited supply alternatives.
What would break the signal?
DSO reversing higher while revenue stays strong (terms loosening to keep the growth rate).
AR/Revenue re-expanding back toward the prior 80%+ zone.
Commentary that shifts from “tight allocation” to “inventory normalization” without a clean offset in new demand sources
Think of MU as a 3-variable function:
Thesis pillar 1: AI/HBM demand is real and sticky
Confirmation: durable mix shift toward high-value memory, capacity spoken for, stable pricing language.
Risk: demand “pull-forward” (customers over-ordering) shows up as softer guide or early working-capital leakage.
Thesis pillar 2: Pricing cycle + supply discipline remains rational
Confirmation: disciplined CapEx framing, controlled capacity adds, constructive contract tone.
Risk: industry adds capacity too quickly → price pressure → guide volatility.
Thesis pillar 3: Cash conversion stays strong
Confirmation: DSO stays compressed, AR growth stays below revenue growth, and management reinforces cash discipline.
Risk: “growth at any cost” posture—terms loosen, AR balloons, or CapEx ramps without payback clarity.
If MU beats and guides strong: what it means for the AI industry
Validates the second derivative of AI spend: confirms that hyperscaler capex is translating into downstream component revenue that is collectible—supportive for the broader AI infra chain beyond the “headline” platforms.
Supports “throughput proof” narratives: strengthens the market’s willingness to underwrite AI infrastructure spend when there’s evidence of unit-economics and cash conversion rather than storytelling.
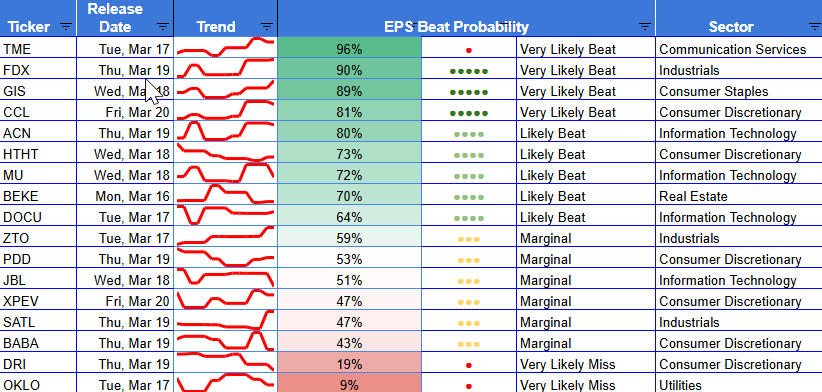
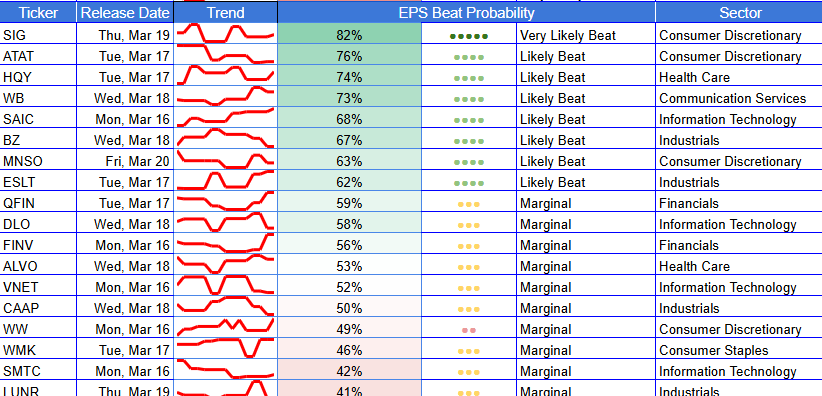
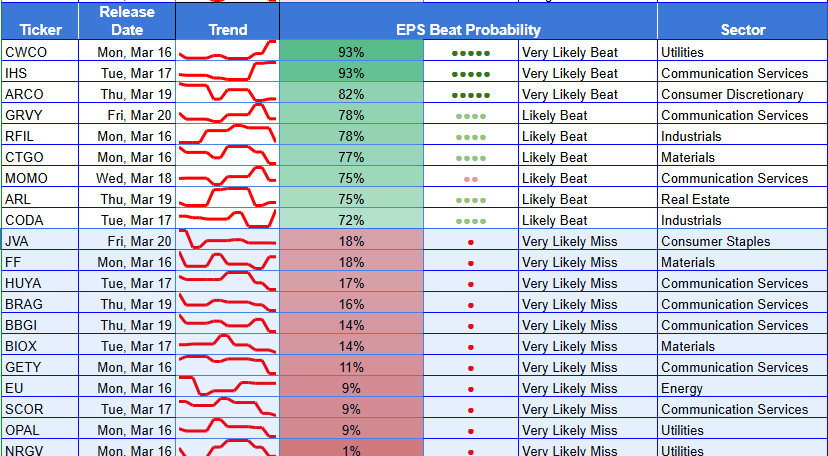
Top 6 Beats / Top 6 Misses for Week of March 16, 2026
✅ Top 6 Beats
TME — 96% (Communication Services, Mid) — Wed 03/18
CWCO — 93% (Utilities, Small) — Wed 03/18
IHS — 93% (Communication Services, Small) — Tue 03/17
FDX — 90% (Industrials, Large) — Thu 03/19
GIS — 89% (Consumer Staples, Large) — Wed 03/18
SIG — 82% (Consumer Discretionary, Mid) — Wed 03/18
⚠️ Top 6 Misses
NRGV — 1% (Utilities, Mid) — Tue 03/17
OPAL — 9% (Energy, Small) — Thu 03/19
SCOR — 15% (Industrials, Small) — Thu 03/19
EU — 9% (Utilities, Small) — Wed 03/18
OKLO — 9% (Utilities, Mid) — Tue 03/17
GETY — 19% (Communication Services, Small) — Thu 03/19
The right tail is concentrated (a few clean, high-conviction names), while the left tail is broader and more “gap-prone,” especially in Utilities/Energy/Small Industrials—classic conditions where guide language can dominate the print.
Heatmap:
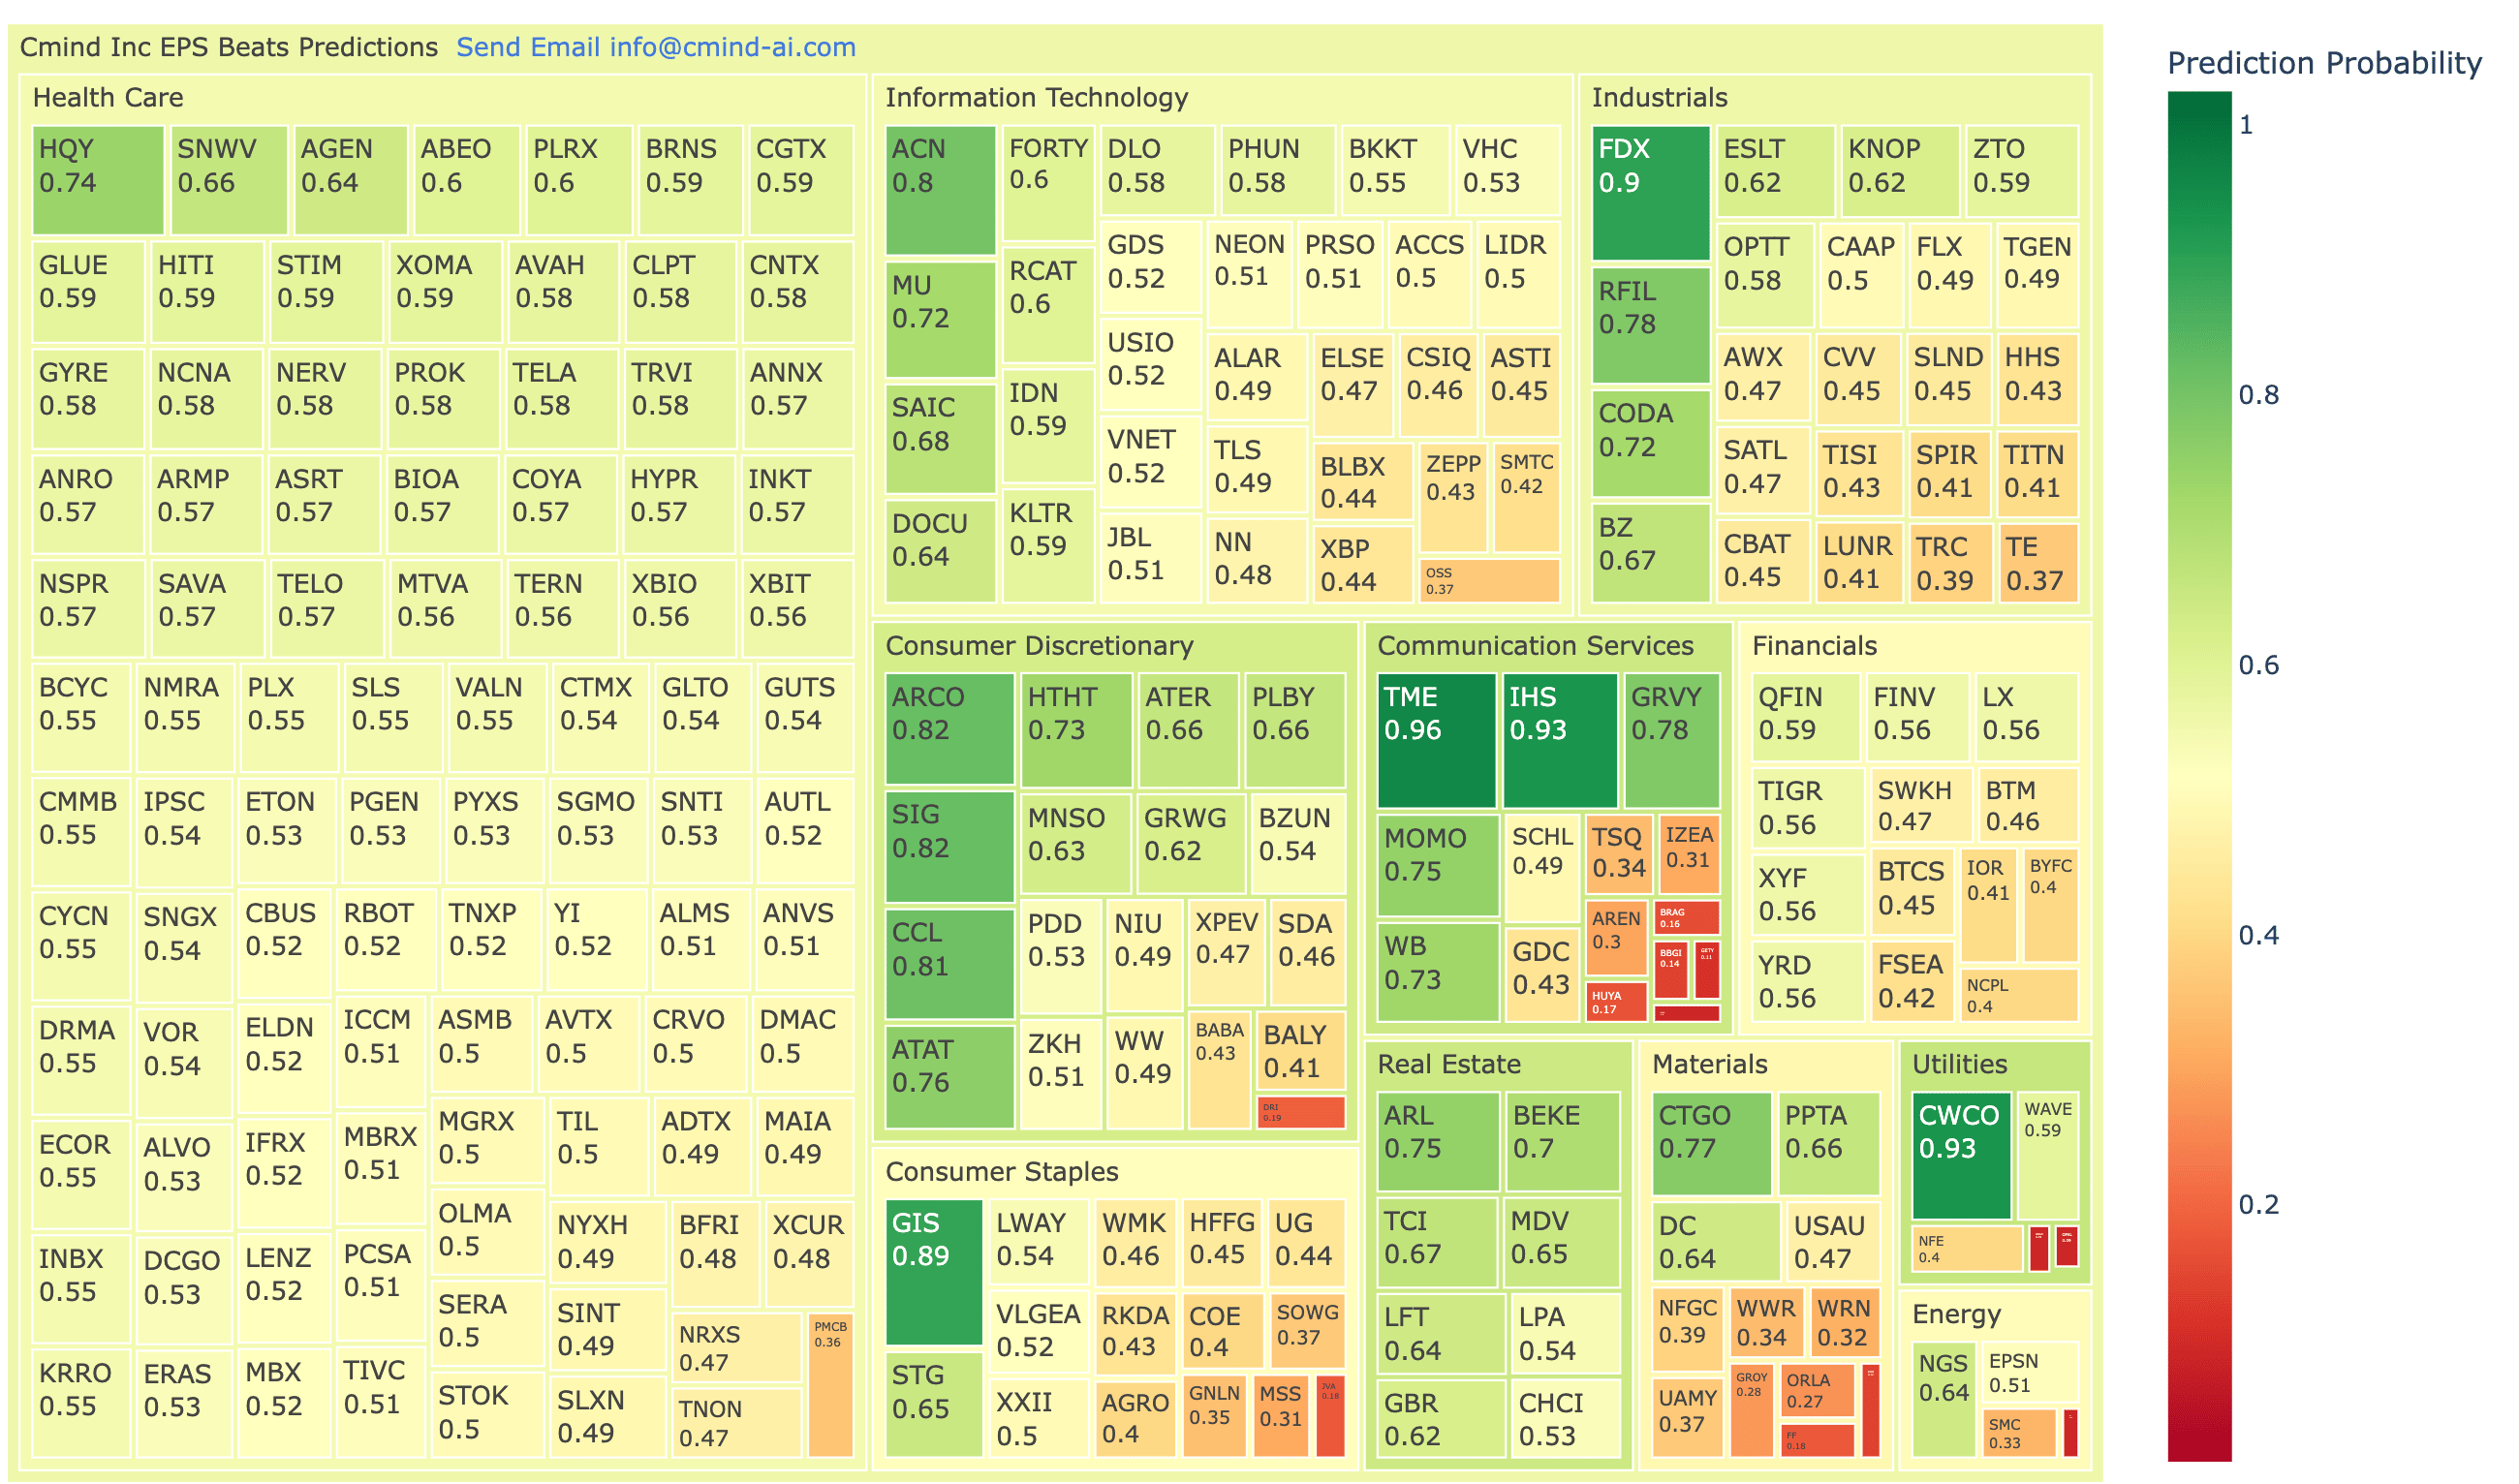
Market cap exposure
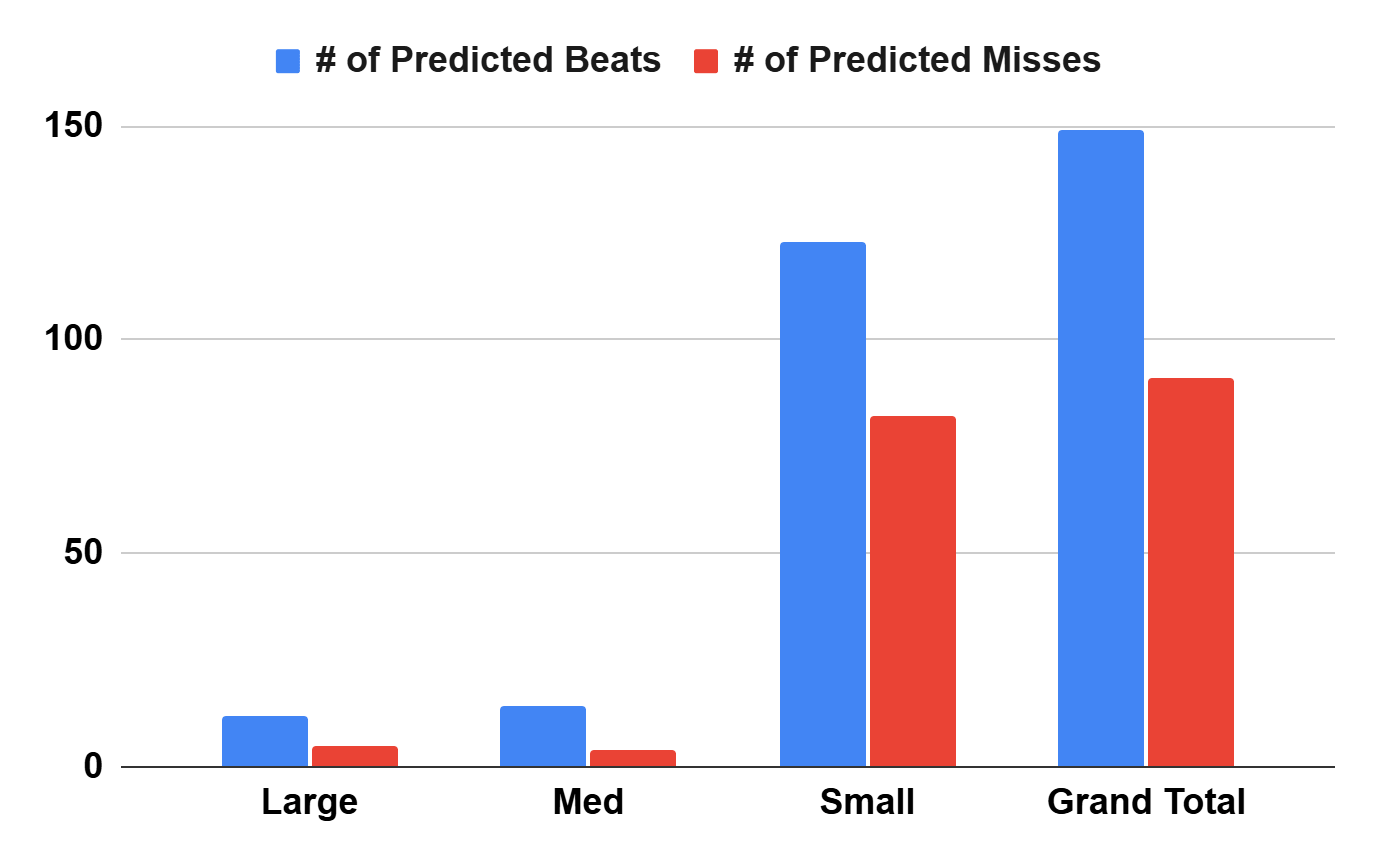
Large cap: more stable distribution with a few standout “execution premium” names. The market is still paying for high-visibility operators—this week FDX (90%) and GIS (89%) are the cleanest large-cap right-tail reads. On the other side, large-cap left-tail risk is less about “blowups” and more about guide sensitivity—names that can miss the reaction function even if the quarter clears.
Mid cap: the most “tradable” pocket this week—enough liquidity to express views, but still wide dispersion. TME (96%) and SIG (82%) sit in the right tail, while OKLO (9%) sits at the opposite extreme—an example of how mid caps can trade like “event-vol instruments” when uncertainty and narrative risk are high.
Small cap: where dispersion turns into convexity. Small caps contain both high-conviction beats (IHS 93%, CWCO 93%) and deep left-tail risk (EU 9%, GETY 19%, SCOR 15%). In this regime, sizing and liquidity discipline matter as much as the signal.
Sector exposure
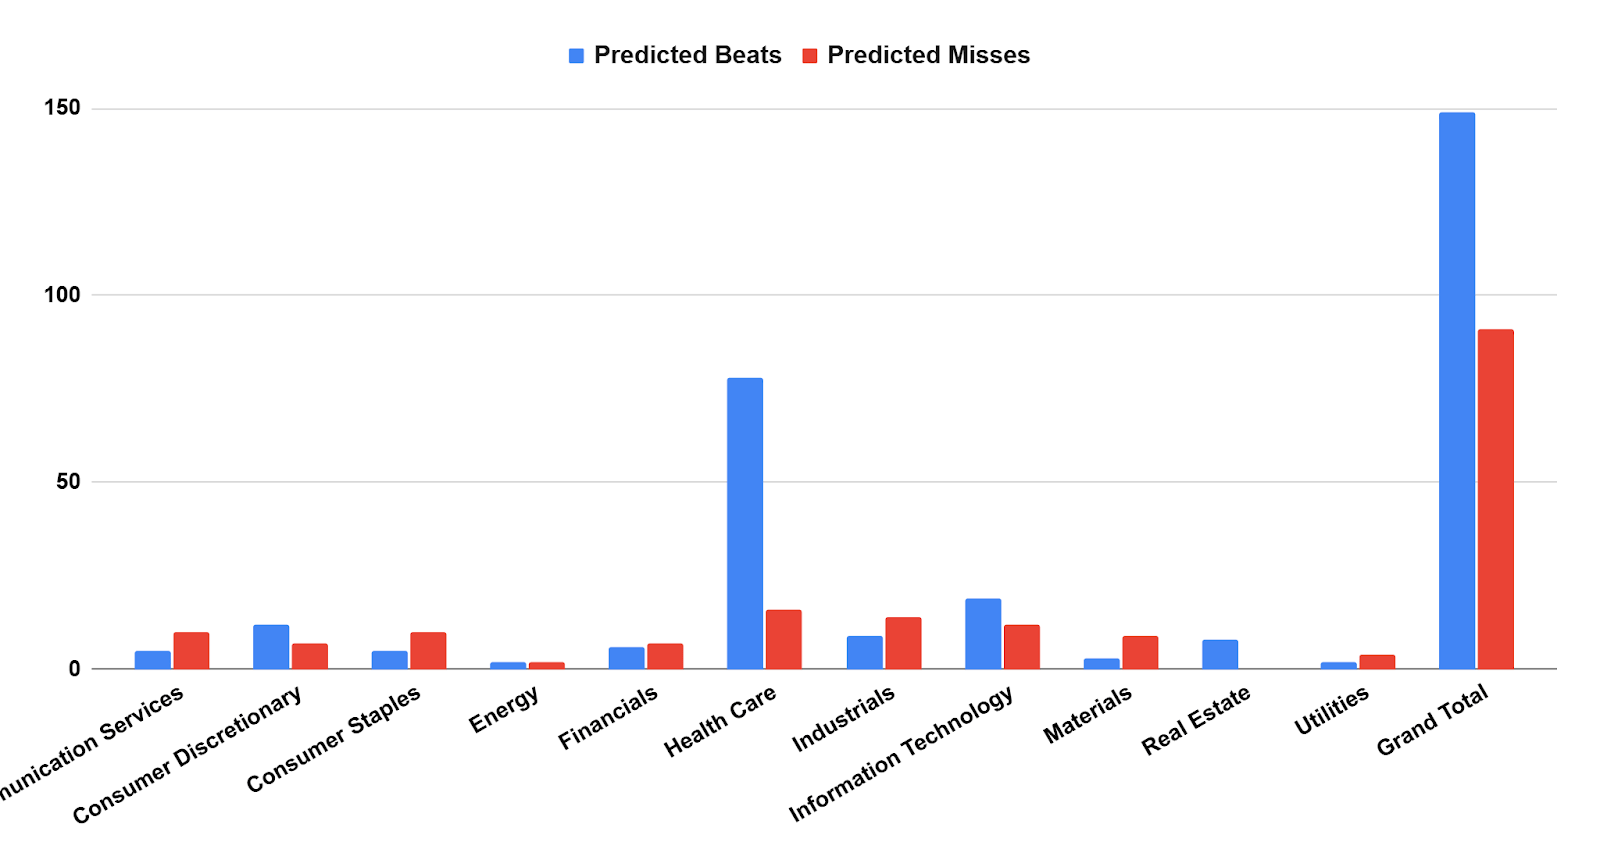
Communication Services: highest average skew in the week, but it’s barbell-shaped: TME (96%) and IHS (93%) anchor the right tail, while GETY (19%) sits in the left tail. Net: strong dispersion, high reaction sensitivity.
Industrials: “execution premium” sector this week. FDX (90%) is the headline, with smaller names creating additional dispersion (including left-tail SCOR 15%). The sector is a clean read-through for throughput, demand cadence, and cost control.
Consumer Staples: relatively constructive with GIS (89%) as the key right-tail anchor. Staples remain “visibility trades” when the broader tape is selective.
Utilities: the most important sector from a risk-management perspective. It contains the single weakest print on the board (NRGV 1%) and one of the strongest (CWCO 93%), plus additional left-tail risk (EU 9%, OKLO 9%). This is exactly what “capex visibility” looks like in practice: the market is separating cash-flow-visible models from timeline/funding-dependent ones.
Information Technology: selective strength rather than broad risk-on. ACN (80%) leads the right tail; DOCU (64%) and PATH (60%) sit in the tradable middle where the guide can move the stock more than the print.
Top Movers (Δ vs last 15 days, ≥ ±10 pts)
Why this matters: movers are where the tape is repricing expectations fastest. These shifts often identify where the reaction cone widened/tightened before the print.
✅ Biggest positive movers (Top 10)
Ticker | Prob | Prior | Δ | Sector | Market Cap Group | Forecast Period Earnings Release Date |
NEON | 51% | 11% | 40 | Information Technology | Small | Tue 03/17 |
FDX | 90% | 54% | 37 | Industrials | Large | Thu 03/19 |
SAVA | 57% | 24% | 33 | Health Care | Small | Tue 03/17 |
VHC | 53% | 39% | 14 | Information Technology | Small | Tue 03/17 |
TGEN | 49% | 37% | 13 | Industrials | Small | Fri 03/20 |
KNOP | 62% | 50% | 13 | Industrials | Small | Thu 03/19 |
SAIC | 68% | 58% | 10 | Information Technology | Mid | Mon 03/16 |
FRD | 47% | 37% | 10 | Materials | Small | Tue 03/17 |
WRN | 32% | 22% | 10 | Materials | Small | Tue 03/17 |
RFL | 78% | 68% | 10 | Industrials | Small | Wed 03/18 |
⚠️ Biggest negative movers (Top 10)
Ticker | Prob | p15 | Δ | Sector | Market Cap Group | Forecast Period Earnings Release Date |
EU | 9% | 52% | -43 | Utilities | Small | Wed 03/18 |
IOR | 41% | 63% | -22 | Financials | Small | Wed 03/18 |
BKKT | 55% | 75% | -21 | Information Technology | Small | Thu 03/19 |
ALAR | 49% | 69% | -20 | Information Technology | Small | Tue 03/17 |
CCJ | 48% | 67% | -19 | Energy | Mid | Wed 03/18 |
ZTO | 59% | 77% | -18 | Industrials | Mid | Tue 03/17 |
OPAL | 9% | 26% | -17 | Energy | Small | Thu 03/19 |
GROY | 27% | 44% | -17 | Materials | Small | Tue 03/17 |
RIVN | 35% | 50% | -15 | Consumer Discretionary | Mid | Thu 03/19 |
TISI | 43% | 58% | -15 | Industrials | Small | Fri 03/20 |
What to watch by day
Mon 03/16: ✅ SAIC 68%, DOCU 64%, KLTR 59% | ⚠️ RCAT 60%, IDN 59%
Tue 03/17: ✅ IHS 93%, NEON 51%, OKLO 9% | ⚠️ NRGV 1%, OKLO 9%
Wed 03/18: ✅ TME 96%, CWCO 93%, GIS 89% | ⚠️ EU 9%, IOR 41%
Thu 03/19: ✅ FDX 90%, SIG 82%, TGEN 49% | ⚠️ OPAL 9%, SCOR 15%
Fri 03/20: ✅ FDX 90%, RFL 78%, KNOP 62% | ⚠️ TISI 43%, SCOR 15%
Options corner
With dispersion concentrated in a few tickers, IV crush risk rises in the “clean” right-tail names if the guide doesn’t expand the narrative. The most important distinction for options positioning is tighten vs widen: names like FDX / GIS / TME can still see post-earnings IV collapse even on solid prints if guidance confirms the base case without adding upside torque. On the left tail (NRGV / OPAL / EU / OKLO / SCOR), the market often prices “known unknowns,” and realized moves can stay large even after the print—especially if financing/timeline commentary shifts.
Setup for next week
Next week, the calendar typically thickens into the late-March transition, where pre-announcement drift can matter more than the official print cadence.
Watch for continued barbell behavior (utilities/energy) and whether Industrials/Staples “visibility trades” persist. If the market keeps rewarding guide clarity, the best opportunities will remain basketable: right-tail execution clusters paired against left-tail fragility flags.
About the Model
Cmind AI’s EPS predictions are powered by a machine learning model built for accuracy, objectivity, transparency, and daily updates with the latest market information. We ingest over 150 variables across five data modalities—including real-time 10-Q filings, earnings transcripts, governance metrics, and peer signals—to provide early, company-specific EPS forecasts.
Our EPS signals update daily across 4,400+ U.S. stocks using a multi-input ML model (filings, transcripts, price/earnings dynamics, governance, and peer signals). The goal isn’t to predict headlines—it’s to quantify where dispersion is most likely so you can build better baskets, hedges, and sizing into catalyst windows.
📩 To learn more, contact us at [email protected].