- Cmind AI by Weihong Zhang
- Posts
- Netflix is the tell—earnings season is shifting from growth stories to conversion math.
Netflix is the tell—earnings season is shifting from growth stories to conversion math.
Heatmap - Financials stay green, Materials stay red | Feature: NFLX 72% is the first “reaction-function” mega-cap print.
John DiBenedetto & Weihong Zhang
January 19, 2026
Hi everyone — welcome to this week’s Cmind Earnings Edge.
This is the “bridge week” between the first macro-sensitive prints (Financials) and the first real mega-cap reaction tests (Communication Services / Tech). Index-level calm can be misleading here: the heatmap is showing tight right-tail clustering across Financials (a broad set of banks/brokers screening 80-93%), while Materials is still where miss-risk is concentrated (AA 26%, NG 28%). In other words, dispersion is doing what dispersion does: it hides in sectors and single names, not in the tape.
This week will trade the reaction function, not the print: beats don’t clear risk if the guide widens, and misses can rally if the forward bridge tightens. Add uneven liquidity/positioning and you get larger-than-expected gaps—especially in lower-liquidity names and already-fragile narratives (cyclical Materials; microcap Financials).
Quick read from the board: Financials are pricing an execution premium; Industrials/IT are mixed (select winners, select risk); Materials is the left-tail hedge; and next week’s headline catalyst is NFLX.
Feature of the Week — Netflix (NFLX): Catalyst for next week
Cmind Beat Probability: 72% (Likely Beat) | Release: Tue, Jan 20 (Post-Market) | Consensus: $0.55 (EPS)
The market is tired of narrative. NFLX is where the narrative has to convert into math. See our chart below that tracks the beat probability of NFLX over time.

Netflix has effectively transitioned from a pure subscription streaming model into a diversified media platform—advertising, live sports, gaming, and now (potentially) a consolidation move via the proposed ~$82.7B acquisition of Warner Bros. Discovery (WBD) assets. That’s not just a “bigger content library” story; it’s a balance-sheet + integration + monetization story. And that’s exactly why this print is so tradeable: it sits at the intersection of growth, leverage, and conversion.
What the model is saying
NFLX has been a high-variance signal since late 2025—swinging from the mid-50s to mid-80s before settling near 72%. Translation: the model leans beat, but the market’s inputs have been mixed (deal/integration risk, ad-tier monetization, timeline credibility).
Structurally, NFLX still screens as a quality outlier on profitability and operating efficiency, and it scores well on management/analyst tone versus the broader streaming complex—so when investors ask “is this real?”, the data has historically been more supportive here than in the median peer set.
Why this matters now
If NFLX is truly building the next leg (ads + live + broader bundle economics), this print is where the market will demand proof in three places:
Advertising: growth + durability. Not just “we’re growing ads,” but how repeatable is the revenue and what does it do to margins?
Engagement economics: ARM > subs. NFLX’s messaging has shifted toward engagement hours, retention, and ARPM/ARM post-price hikes. The market will reward a clean bridge from engagement → ARPM → margin.
WBD integration math. The proposed WBD asset acquisition raises the biggest reaction-function question: is the path to integration and synergy credible relative to leverage and regulatory friction?
The NFLX “reaction function” checklist
If you only have time to focus on a few lines from the release + call, focus here:
Ad-tier updates: ARPM trajectory, inventory fill, churn dynamics, and any commentary that ties ads to incremental margin (not just revenue).
Integration timeline (WBD): clarity on 12–18 month milestones, synergy framing, and what changes operationally (content costs, distribution, bundling).
Balance sheet posture: any language that reduces ambiguity around leverage, financing plan, and capital allocation.
2026 margin guide (+300 bps sensitivity): the bull-case setup is that clarity on regulatory path + margin guide sparks relief; the bear-case setup is that debt/integration uncertainty overwhelms a decent print.
NFLX is a “likely beat,” but the real edge is reading the guide as a probability update. If the forward bridge tightens (ads + integration + margin) the tape will treat it as a de-risking event. If it stays fuzzy, even a beat can be a fade.

Beats (%) + what to watch
SCHW — 93% (Financials)
Watch forward tone around client activity and net new assets; execution consistency matters more than the quarter’s absolute number.ABT — 92% (Health Care)
Look for clean margin/volume commentary and any clarity that reduces forward uncertainty.JNJ — 92% (Health Care)
The reaction will hinge on guidance clarity and any commentary that tightens the forward bridge.CMA — 91% (Financials)
Watch deposit/funding tone and credit posture—anything that signals stability will be rewarded.FITB — 91% (Financials)
The market will pay for disciplined expense control and credit normalization language.USB — 91% (Financials)
Watch NII path, deposit beta, and credit costs—guidance tightness is the trade.
Top 6 Misses (%) + what to watch
SLM — 20% (Financials)
The market will focus on credit quality and funding dynamics; weak forward framing can gap this.AA — 26% (Materials)
Watch demand/margin commentary; “macro hand-waving” tends to get punished in this regime. Clustering in Materials.NG — 28% (Materials)
The key is whether management can quantify the bridge (volume/pricing/costs) rather than narrate it.PAPL — 30% (Financials)
Liquidity amplifies gaps—any ambiguity on fundamentals tends to travel.CLST — 31% (Financials)
Watch for balance sheet stamina language; uncertainty tends to be priced harshly in small caps.RMBI — 35% (Financials)
Credit + funding tone is everything; if the guide widens, the tape usually reacts first and asks questions later.
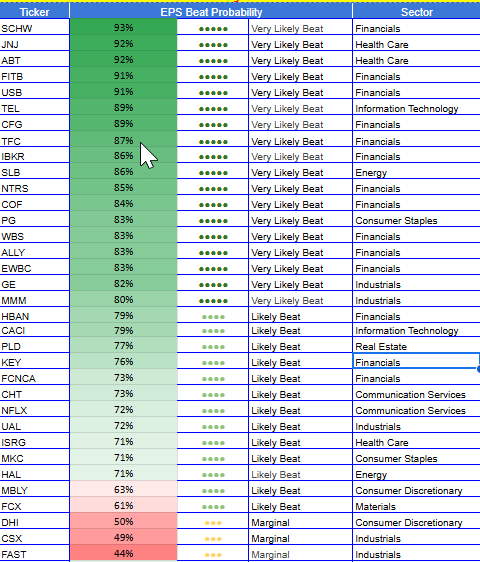
Heatmap

Market Cap exposure

Large-cap/mega-cap: The large names on the board lean “execution-positive” rather than euphoric. ABT/JNJ (92%) and PG (83%) screen as high-visibility right tail. In cyclicals, GE (82%) and MMM (80%) are constructive but not “free money”—they sit in the zone where guidance quality will decide whether the tape pays up. NFLX (72%) is the flagship large-cap catalyst next week: likely beat, but highly sensitive to forward math.
Mid-cap: This is where the heatmap is most useful for basket construction. The mid-cap Financials complex is broadly green (lots of 70-85% reads), which supports beta-neutral and factor-neutral constructions (long right-tail financials vs targeted left-tail hedges). This is “process alpha” territory: tighten exposure, size for liquidity, and use dispersion rather than direction.

Small-cap: Small-cap remains the volatility pocket. The left-tail names (especially smaller Financials and Materials) are where gaps happen—often independent of macro. If you’re building hedges, small-cap left tail is the cleanest convexity on the board; just respect liquidity.

Sector exposure
Financials — the super-cluster
Financials dominate the board and are unusually green at the top: SCHW (93%), CMA/FITB/USB (91%), ORI (90%), CFG (89%), TFC (87%), IBKR/PNFP (86%). That breadth matters: it’s easier to build bank/broker baskets when signals converge.
How to use it:
Long basket: focus on the highest-conviction right-tail cluster (execution premium).
Hedges: the left-tail micro financials (SLM/PAPL/CLST/RMBI) are the “gap risk” offsets.
Reaction function: guides that tighten NII/credit/expense bands will separate winners from “met-but-questioned” names
Industrials — selective green, not broad green
GE (82%) and MMM (80%) anchor the right tail; airlines are constructive but not unanimous (ALK/UAL 72%), while transport/logistics names show more fragility (CSX 49%, GATX 48%, FAST 44%). This is a classic “selectivity regime”: the market is underwriting execution but punishing any hint of demand wobble or margin ambiguity.
Information Technology — mixed dispersion
A small right-tail cluster (TEL 89%, PRGS/ACMR 83%) contrasts with more neutral-to-risk names (LYTS 52%). This is a “prove it” pocket: the tape will trade guide quality and margin cadence.
Health Care — visibility is paid
ABT/JNJ at 92% is the cleanest “visibility trade” signal on the board. Not risk-off—visibility-on.
Energy — constructive, but watch macro overlay
SLB 86% screens strongly, HAL 71% is supportive. Reaction risk increases if the macro tape shifts, but the model is leaning execution-positive.
Materials — left-tail hedge cluster
AA 26%, NG 28% are the standout miss-risk clusters. This is where “macro excuses” get punished hardest; the market wants quantifiable bridges.

Top Movers (±10 pts week over week)
This week’s mover tape is dominated by probability compression to the upside in liquid, system-friendly names, led by ACMR (+32 to 83%) and BAH (+26 to 70%), with Financials stacking and a supportive bid in industrial/defense-adjacent exposure (GE) plus select tech (TEL/PRGS/OSIS/CACI). The model is seeing late-window alignment across multiple inputs, which is exactly when basket construction tends to get cleaner.
On the other side, SLM’s collapse (−37 to 19%) is the loudest risk signal on the board—when a name flips from mid-band to deep left-tail in a week, it usually implies the model is penalizing fragility (earnings quality, balance-sheet sensitivity, or guidance-risk proxies).
✅ Upward shifts
ACMR: 50.7% → 83.4% (+32.7)
BAH: 43.3% → 70.0% (+26.6)
TFC: 65.5% → 87.5% (+22.0)
WTFC: 63.6% → 84.3% (+20.7)
UAL: 52.4% → 71.6% (+19.2)
ORI: 71.4% → 89.6% (+18.1)
NFLX: 54.7% → 72.2% (+17.5)
SLB: 68.5% → 85.8% (+17.3)
⚠️ Downward shifts
SLM: 57.1% → 19.6% (−37.6)
NG: 47.4% → 27.9% (−19.5)
GATX: 65.9% → 48.3% (−17.6)
CASS: 73.2% → 59.2% (−14.0)
HZO: 51.8% → 38.6% (−13.2)
Set up for next week
Next week is where earnings season starts to “feel real” again: more high-attention catalysts, more cross-sector read-throughs, and more opportunities for dispersion-first positioning.
Two things to watch:
NFLX as the Communication Services reaction-function test. If it converts ads + integration math into confidence, it can change how the market prices the whole “platform consolidation” complex.
Whether Financials keep the execution premium. If guidance stays tight, the sector can remain a stabilizer; if guidance bands widen, dispersion increases fast.
About the Model
Cmind AI’s EPS predictions are powered by a machine learning model built for accuracy, objectivity, transparency, and daily updates with the latest market information. We ingest over 150 variables across five data modalities—including real-time 10-Q filings, earnings transcripts, governance metrics, and peer signals—to provide early, company-specific EPS forecasts.
Our EPS signals update daily across 4,400+ U.S. stocks using a multi-input ML model (filings, transcripts, price/earnings dynamics, governance, and peer signals). The goal isn’t to predict headlines—it’s to quantify where dispersion is most likely so you can build better baskets, hedges, and sizing into catalyst windows.
📩 To learn more, contact us at [email protected]