- Cmind AI by Weihong Zhang
- Posts
- Thanksgiving - Deere at 95%: The Execution Premium Is Back
Thanksgiving - Deere at 95%: The Execution Premium Is Back
Deere sets tone for Industrials; software/retail hinge on guidance into December.
John DiBenedetto & Weihong Zhang
November 24, 2025
Welcome to everyone!
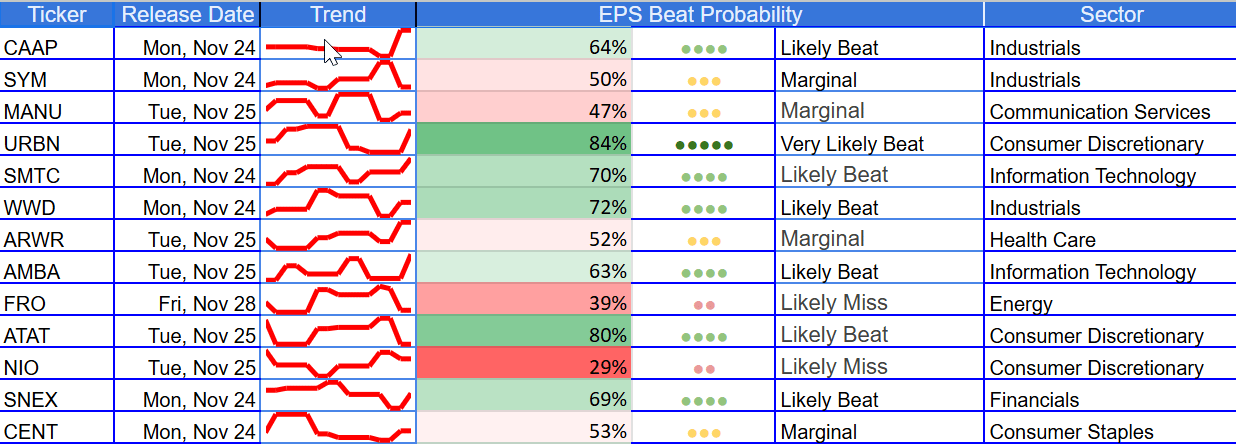
Thanksgiving week is lighter in count but rich in dispersion. The new heatmaps show contiguous green in execution-led Industrials and platform-heavy Tech/Comm Services. At the same time, oranges/reds gather in rate-sensitives, peripheral & PC-tilted tech, and promo-dependent consumer pockets. The right tail is anchored by Deere (DE, 96%) at the large-cap level, URBN (84%), WWD (72%), SMTC (70%) in mid caps, and a small-cap cluster led by BLBD (82%), SDOT (74%), TIGR (71%). On the left tail, notable miss-risk sits in LEE (13%), ZH (25%), CVAC (29%), TITN (27%), and, in mid/large caps, NIO (29%), FRO (39%).
Next week is the hand off to retail and software—focus on the guidance. In retail (BBY, specialty), watch margins first—promo cadence, inventory discipline, wage/ship; comps are secondary. In software (ADSK, WDAY, ZS, NTNX, ZM), pay for visibility and pricing power—clean net retention, durable upsell, and credible AI monetization, not TAM. If DE confirms the execution premium in Industrials, expect follow-through into smaller contractors and logistics names; if the guide is cautious, dispersion widens and pairs outperform outright longs. With rates likely in a longer pause, the onus shifts to refinancing windows and balance-sheet stamina—a setup that continues to reward quality mid/small executors and penalize levered, promo-dependent names through year-end.
Featured Stock of the Week — Deere & Co. (DE)
Deere is our large-cap bellwether this week: the Cmind model’s beat probability has re-rated to 96%, the strongest tile on the board, making DE the cleanest expression of the “execution premium” we’re seeing in Industrials. The daily series since September shows three distinct phases that support the call:
mid-September step-up from 56% into the low-70s as channel checks and management language around price/mix, efficiency, and precision-ag improved;
early-October jump into the mid-80s on margin quality signals and tighter working-capital prints;
Then a late-Oct/early-Nov reset back toward 60-70% as headlines on large-ag demand, tariffs, and North America construction softness crept in.
Crucially, the series then spiked day over day into mid-November—from 66% (11/17) to the mid-90s by 11/19—as our inputs showed better backlog conversion, firmer price realization, and a cleaner expense run rate, aligning with the heatmap’s deep-green read. Against consensus EPS of ~$3.96, our base case is a clean beat, with a guide that emphasizes mix discipline, productivity, and cash conversion, even as management remains conservative on FY25/FY26 top-line pacing.
The multi-year “EPS Beats History” panel shows that when DE’s probability sits ≥65%, actual results have typically landed above consensus, and the current print lines up with the upper-decile regime seen during prior margin-driven beats—useful context with consensus EPS around $3.96 for Q4 (see DE graph below). Street narratives still lean cautious—FY25 net-income guidance was narrowed to $4.75–$5.25B, North America large-agriculture and construction are down YoY, and management continues to flag tariff and demand uncertainty—but the model reads mix discipline, productivity, and cash conversion as offsets likely to support a beat.
Into the call, focus on Production & Precision Ag (PPA) margin, dealer inventory normalization, construction & forestry cadence, and price realization vs. input costs—these are the levers that moved our score.


See how our model tracks the earnings beat, major commentaries, and corporate events daily since its last earnings release.

Sector Preview
This week’s sector tape is dispersion over direction. Industrials wear the crown again as execution and backlog visibility dominate. Tech & Communication Services are two-tone: platforms/infrastructure such as NTAP (79%) and the analytics/security cohort (ADSK 63%, ZM 58%, ZS 57%, HPQ 56%, ADI 54%) lean constructive, while peripherals and China app/e-comm (BABA 50%, BZUN 49%, ZH 25%) sit in the orange/red. Financials stay split with credit/processors modestly green vs funding-sensitive small caps like RMCO 28%), Health Care favors selective quality (EMBC 62%, CENT 53%, ARWR 52%).
Energy/Materials are mixed (FRO 39%; TORO, ASPI 29%), and Real Estate/Utilities remain rate-sensitive (MDRR 60%; CLFD 45%). Industrials again set the pace. DE (96%) is the cleanest right-tail large-cap—our model reads price/mix resilience, disciplined opex, and solid cash conversion—while Keysight (KEYS 82%) adds a quality instrumentation/test tile that benefits from durable enterprise/defense demand. Beneath the megacaps, the mid/small cohort is equally telling: Semtech (SMTC 70%), Woodward (WWD 72%), and Blue Bird (BLBD 82%), stack green on backlog visibility and throughput gains. Where we’re cautious: levered, rate-exposed service names and late-cycle trucking/machinery that sit orange/red, where operating leverage can cut quickly if volumes wobble.
Consumer splits cleanly between brand-power executors and promotion-exposed laggards. URBN (84%) and WWD (72%) headline mid-cap discretionary with healthy mix and inventory discipline, while SJM (86%) anchors staples on price architecture and cost control. On the fragile side, BBY (47%) screens below median into a promo-heavy window, and LEE (13%) sits at the far left tail with funding/operating uncertainty.
Financials is not a directional bet. PNNT (61%) and GASS (57%) sit just above neutral, reflecting steadier credit performance and fee stability in niches that aren’t overly duration-sensitive; QFIN (not on this week’s board) has been printing green recently in our system and serves as a useful comp for stable underwriting. The left tail gathers around funding-sensitive small caps like RMCO (28%), where access to capital and liability costs dominate the narrative. With the rate backdrop in a “longer pause,” the dispersion inside Financials is driven more by balance-sheet mix and credit discipline than by the level of yields.
This week is light on megacap Health Care tiles, but the map still distinguishes quality from binary risk. EMBC (62%) sits in the constructive lane if guidance confirms payer/provider dynamics and cost containment; CENT (53%) and ARWR (52%) are “watch-and-verify” names where pipeline progress and gross-margin cadence will steer the reaction. We favor company-by-company selection: own operators with visibility (services/platforms, clear reimbursement) and avoid speculative R&D without catalysts.
Real Estate & Utilities bears caution as the map continues to punish leverage and reward contracted visibility. MDRR (60%) screens on the constructive side where revenue is regulated or contracted and debt ladders are manageable; CLFD (45%) underscores how quickly operating leverage turns against rate-exposed names. With policy rates likely in a longer pause, the key isn’t the direction of yields but refinancing math—maturity walls, spreads, and covenant headroom.

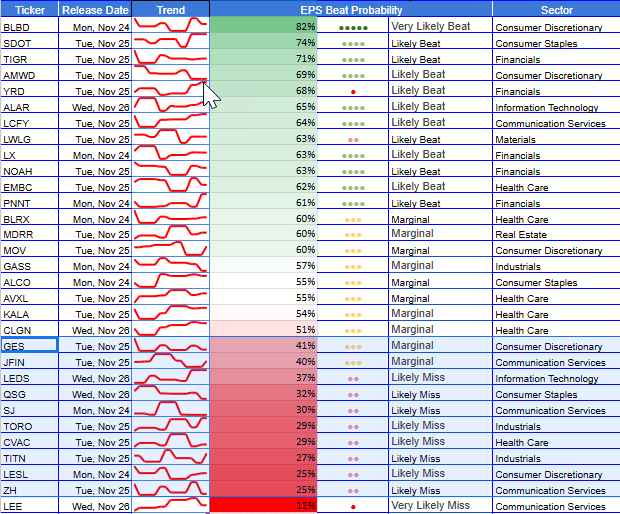
This week’s market-cap lens is dispersion, not direction. In Large Caps, leadership is clear—DE (96%) sets the tone with SJM (86%), KEYS (82%) and NTAP (79%)—but the reaction function lives in a “prove-it” band where guides trump prints (NTNX, WDAY, ZM, ZS, ADI, HPQ). In Mid Caps, spreads are richest: execution names—URBN (84%), WWD (72%), SMTC (70%), CAAP (64%), AMBA (63%)—screen green against left-tail risks like NIO (29%) and FRO (39%). Small Caps are the convexity frontier—right-tail standouts (BLBD 82%, SDOT 74%, TIGR 71%, AMWD 69%, YRD 68%) versus fragile names (LEE 13%, ZH 25%, CVAC 29%, TITN 27%, TORO 29%). Confirmation wins Q4—build a drift sleeve and add only when the guide lands.
🔝Top Predicted Beats This Week
DE (Nov 26) - 96% - Industrials - Large Cap
SJM (Nov 25) - 86% - Consumer Staples - Large Cap
URBN (Nov 25) - 84% - Consumer Discretionary - Mid Cap
KEYS (Nov 24) - 82% - Information Technology - Large Cap
BLBD (Nov 24) - 82% - Industrials - Small Cap
ATAT (Nov 25) - 80% - Consumer Discretionary - Large Cap
🔻Top Predicted Misses This Week
LEE (Nov 26) — 12% - Communication Services - Small Cap
ZH (Nov 25) — 25% - Communication Services - Small Cap
LESL (Nov 24) - 25% - Consumer Discretionary - Small Cap
TITN (Nov 25) — 27% - Industrials - Small Cap
CVAC (Nov 25) — 29% - Health Care - Small Cap
TORO (Nov 25) — 29% - Industrials - Small Cap
NIO (Nov 25) — 29% - Discretionary - Mid Cap
(As of November 20, 2025)
This week’s map is decisively dispersion-led: a broad green belt clusters where execution quality and backlog visibility dominate, while the red tail concentrates in funding-sensitive and promotion-dependent names. Small/mid industrials and platforms anchor the right side of the distribution—BLBD (82%), SDOT (74%), TIGR (71%), AMWD (69%), YRD (68%)—and mid-cap operators like URBN (84%), ATAT (80%), WWD (72%), SMTC (70%). In large caps, DE (96%) leads the tape with SJM (86%), KEYS (82%), NTAP (79%) extending the constructive tone, while a guide-sensitive 0.58–0.65 cohort—NTNX (59%), WDAY (59%), ZM (58%), ZS (57%), ADSK (63%)—will likely determine whether beats translate into follow-through. The left tail is loudest in small and select mid caps—LEE (13%), ZH (25%), CVAC (29%), TITN (27%), TORO (29%), NIO (29%), FRO (39%)—where financing windows, unit economics, or margin carry-through look most fragile.
Click here or the following heat map to see an interactive version.

Next Week & Q4 Setup
Next week is guide-led, not print-led: the focal set sits in the 0.58–0.65 “prove-it” band—NTNX / WDAY / ZM / ZS / HPQ / ADI—where the reaction hinges on pricing power, renewal/NRR, backlog conversion, and FY26 visibility rather than headline beats. A clean round of software guides (e.g., ADSK/WDAY/ZS) keeps platform-adjacent tech bid and supports the constructive tone we already see in NTAP/KEYS; muddier messages preserve a stock-picker’s tape and funnel flows back into mid-cap execution (e.g., URBN/WWD/SMTC/CAAP) and large-cap Industrials anchored by DE.
For Q4 positioning, the alpha density still lives in Mid—our right-tail cohort of URBN (84), ATAT (80), WWD (72), SMTC (70), CAAP (64), AMBA (63)—versus a left-tail set of NIO (29), FRO (39) and fragile smalls (LEE 13, ZH 25, CVAC 29, TITN 27, TORO 29), where refinancing costs, operating leverage, and guide precision can cut sharply. Small caps remain the convexity frontier—right tail BLBD, SDOT, TIGR, AMWD, YRD vs left tail LEE, ZH, CVAC, TITN, TORO. Finally, keep a post-earnings drift sleeve and add on confirmation: dispersion remains your friend into Q4.
Individual Stock Predictions
Large Caps
Large caps remain a stock-picker’s tape. The right-tail leadership is clear: Deere (DE 96%) sits at the top of the board and is joined by J.M. Smucker (SJM 86%), Keysight (KEYS 82%), and a credible NetApp (NTAP 79%) tile. That cohort shares the same DNA—pricing power, disciplined cost control, and cleaner cash conversion—so when prints are coupled with confident guides, these names tend to exhibit multi-session post-earnings drift. The center of gravity for next week, however, is the “prove-it” band where reaction is dominated by guidance quality rather than the P&L line: Nutanix (NTNX 59%), Workday (WDAY 59%), Zoom (ZM 58%), Zscaler (ZS 57%), Analog Devices (ADI 54%), and HP (HPQ 56%). This is where small deltas in renewal cadence, NRR/seat expansion, or backlog conversion can swing the tape.

MidCaps
Mid-caps continue to offer the best “spread capture” on our map, with a distinct right tail that rewards execution and balance-sheet discipline. Urban Outfitters (URBN 84%), Woodward (WWD 72%), Semtech (SMTC 70%), and Corporación América Airports (CAAP 64%) anchor the green belt. These companies screen well on price/mix, backlog visibility, and cost control, and that combination has historically produced a reliable 10–20 session drift when guidance confirms the print. The left-tail set is equally usable: Frontline (FRO 39%) and Manchester United (MANU 47%) carry headline and operating-leverage risk, while NIO (29%) remains a financing/competitive-intensity story. This makes the mid-cap graphic an ideal canvas for pairs—long confirmed executors vs. shorts where refinancing costs, operating leverage, or guide precision can cut sharply.
Small Cap
Small caps show the loudest dispersion and the sharpest tails—perfect for a graphic that spotlights both opportunity and risk. The right-tail cluster includes Blue Bird (BLBD 82%), Samsara Networks (SDOT 74%), UP Fintech (TIGR 71%), American Woodmark (AMWD 69%), Yiren Digital (YRD 68%) plus LCFY, LWLG, LX (63-64%)—names that benefit from clearer unit economics, backlog/mix carry-through, or cost discipline. On the left-tail, the caution list is unambiguous: Lee Enterprises (LEE 13%), Zhihu (ZH 25%), CureVac (CVAC 29%), Titan Machinery (TITN 27%), and Toro (TORO 29%), along with several micro-cap “story” names clustered in the 30-40% zone where funding windows and margin carry-through look fragile. Because liquidity is thinner, treat the small-cap graphic as a convexity toolkit.
Into the holiday calendar and Q4 re-positioning, small-cap tails can travel fast—tax-loss harvesting and year-end window-dressing amplify both drift and reversals. Use the beats/misses tiles to stage a beta-neutral book: partner one or two green names with a hedge from the red block, then let confirmation drive adds or trims. Done right, this section can deliver the week’s highest information ratio with tightly controlled capital.
Next week & Q4
Large Cap: Focus shifts from mega-cap prints to retail and software, where guidance drives reactions more than results. In retail, margins—not comps—will matter most, with promo intensity and inventory discipline as key tells. In software, pay for visibility and pricing power—clean retention and credible AI monetization. NVDA remains the swing factor; supply cadence and mix will determine whether platform tech stays bid or reverts to selective stock-picking.
Mid-Cap: Execution is still the alpha source—pricing power, backlog conversion, and cost control define the right tail. Treat pairs carefully; misaligned guides or refinancing costs can flip outcomes fast. Scale exposure only when guidance supports backlog strength, as this tier offers the best spread capture and post-print drift into Q4.
Small Cap: The high-volatility frontier continues—winners show unit-economics clarity and backlog carry-through, while laggards face funding strain and promotional fragility. Trade size to liquidity and plan exits early. Expect dispersion to widen through Q4 as tax-loss selling and refinancing timelines separate durable operators from momentum plays.
About the Model
Cmind AI’s EPS predictions are powered by a machine learning model built for accuracy, objectivity, and transparency. We ingest over 150 variables across six data modalities—including real-time 10-Q filings, earnings transcripts, governance metrics, and peer signals—to provide early, company-specific EPS forecasts.
Updated daily, our model covers 4,400+ public companies, with proven backtests demonstrating improvements in Sharpe and Sortino ratios across portfolios.
📩 To learn more, contact us at [email protected]