- Cmind AI by Weihong Zhang
- Posts
- This Week Is Dispersion—Disney, AI, and the Retail Setup
This Week Is Dispersion—Disney, AI, and the Retail Setup
Health Care and platforms lean green; watch DIS guidance and early holiday reads to set the next 30 days.
John DiBenedetto & Weihong Zhang
November 10, 2025
Hi everyone!
This week is heavy Monday–Thursday and quieter Friday—treat the cluster like a macro event, but trade it single-name: the tape is paying for forward guides and unit economics, not backward prints. Disney is the week’s swing catalyst—our model whipsawed from ~90% to ~60% and back near ~80% heading in, which means the guide will drive the tape.
Health Care screens broadly green (managed care, med-tech, select biotech) on pricing and utilization discipline. Communication Services favors platforms/networks while the ad-dependent long tail stays uneven. Tech is split—AI/compute and networking lean green; peripherals/PC-tilted and smaller software are mixed. Industrials reward backlog-rich operators and services; trucking/machinery show miss risk on shaky volumes. Financials look fine in insurers/processors, but consumer credit / alternative finance tiles redden into the holidays. Real Estate/Utilities remain duration and balance-sheet stories, with data centers/industrial REITs outpacing office/levered retail. Consumer is mixed—brand power helps discretionary; Staples are bifurcated, with price-takers under promo pressure.
It’s still a stock-picker’s tape. Health Care and Comm Services lean green; Industrials and Financials are a barbell; Consumer Staples and duration-heavy rate sensitives are where miss risk is clustering. Looking 30 days out, the season hands the baton to retail and software; revisions breadth—not headline beats—will decide whether Q4 carry holds.
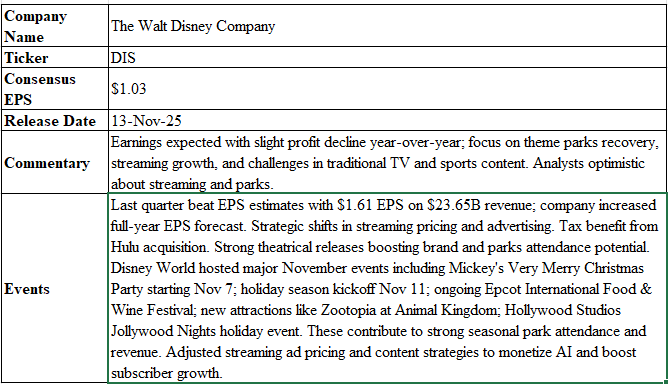
Feature: Disney (DIS) (Nov 13, 8:30 am)
As a diversified bellwether across parks, streaming and legacy media DIS is a live read on consumer leisure, ad spend and how incumbents are converting scale into streaming profits. Street setup is roughly +1% in YOY revenue to approximately$22.8B with EPS between $1.02-1.03 (down about 10% YOY) - a deliberate “mixed” bar that puts the burden on guidance quality.
Since last quarter’s $1.61 EPS on $23.65B and a raised FY outlook, Disney leaned into DTC pricing + ad-tier monetization and heads into peak seasonal Parks events (Mickey’s Very Merry Christmas Party, holiday kickoffs, Jollywood Nights). Those drivers can cushion media softness via attendance, per-cap, and cross-sell.
What the prediction score shifts are signaling:
Our daily beat-probability path ~60% (late August) → ~90% (mid-October) → ~60% (Nov 6) → ~80% (this week) signals a fragile consensus:
The rise to 90% aligned with cleaner text/estimate revisions around DTC ARPU and cost discipline plus improving parks seasonality—i.e., the market rewarded evidence of a credible path to streaming profitability while parks turned supportive.
The drop to ~60% reflected headline-driven wobble (media/sports narrative, option-implieds, micro estimate tweaks) that questioned near-term margin cadence.
The rebound to ~80% suggests stabilization into the event as price/flow normalized and expectations re-centered on updated guide language.
Net: the tape is highly guide-sensitive; small deltas in DTC profitability timing, ARPU, or sports distribution can swing sentiment fast.
Bottom line, Disney remains a barometer for U.S. entertainment spending and for how media incumbents convert scale into sustainable streaming economics. A clean print with credible progress on DTC margins and resilient parks would support broader risk appetite across platforms and live-event ecosystems, while a muddier message keeps investors anchored to a stock-picker’s market where execution—and the cadence of guidance—decides winners.
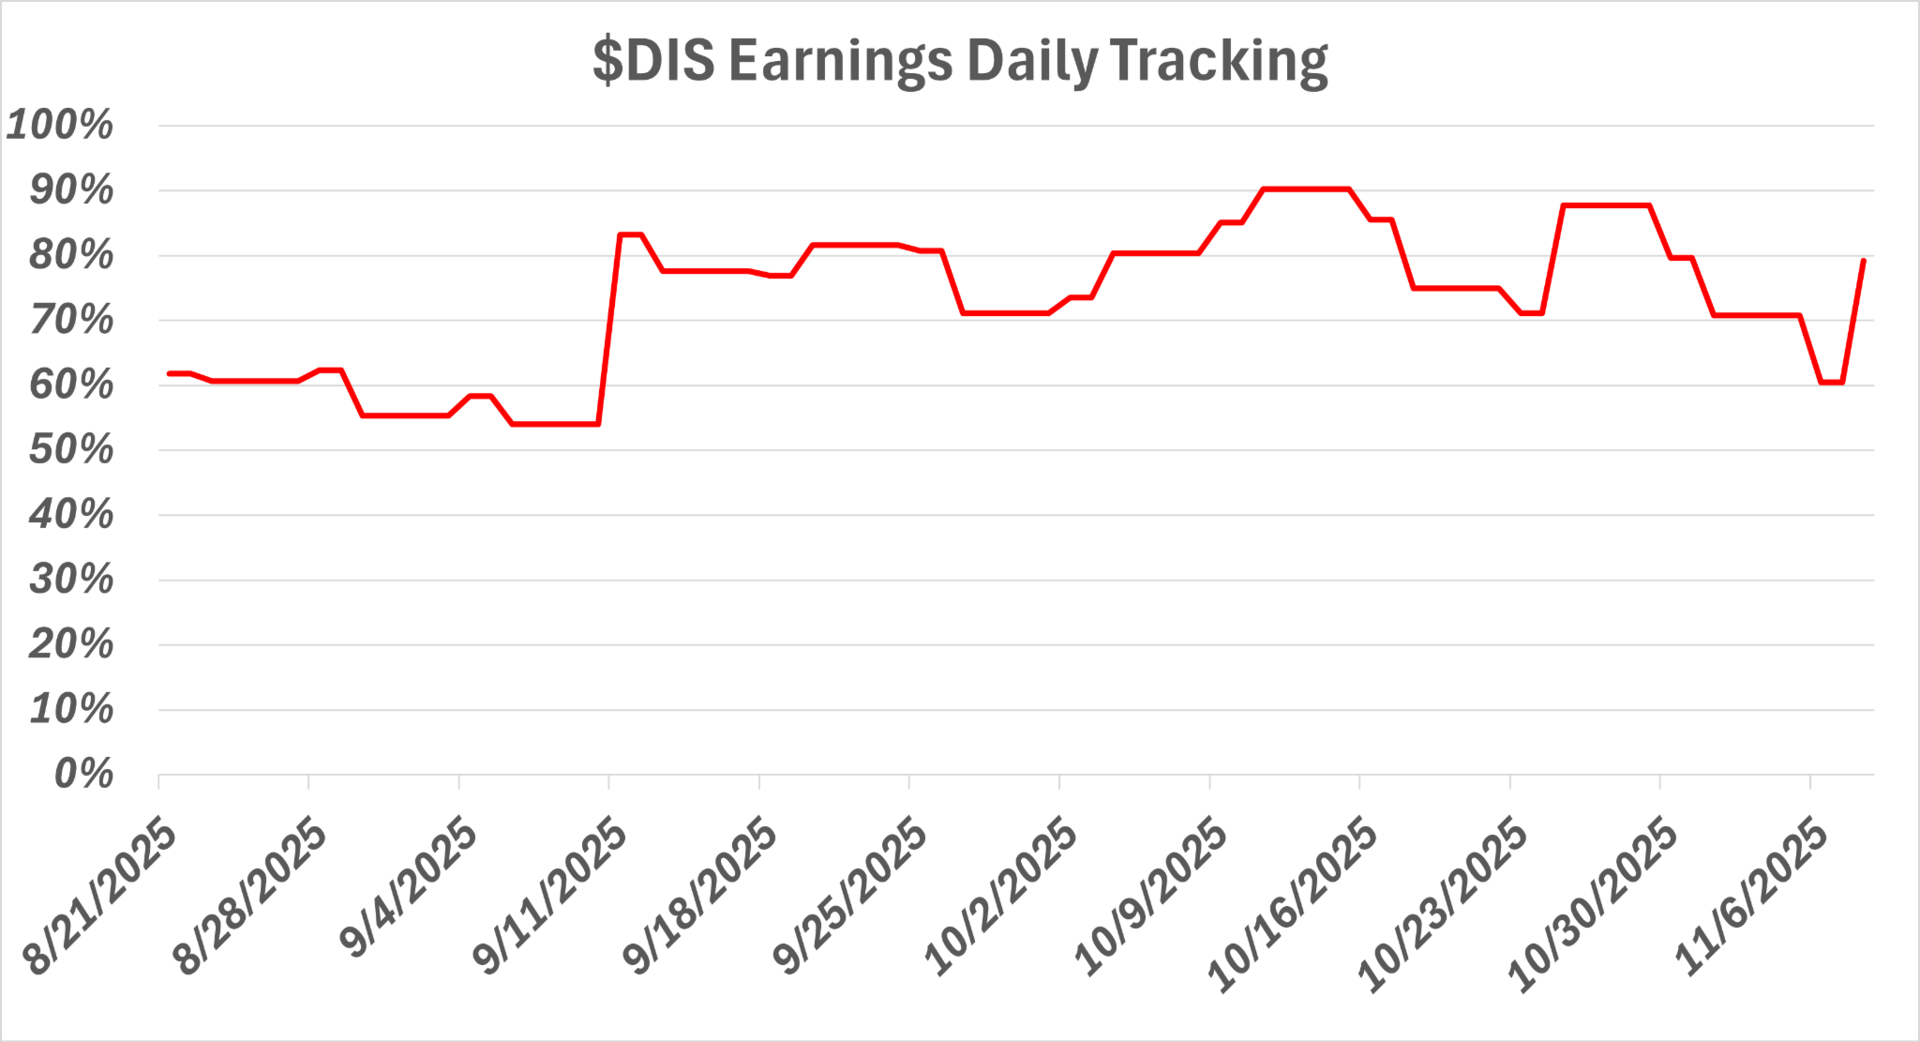
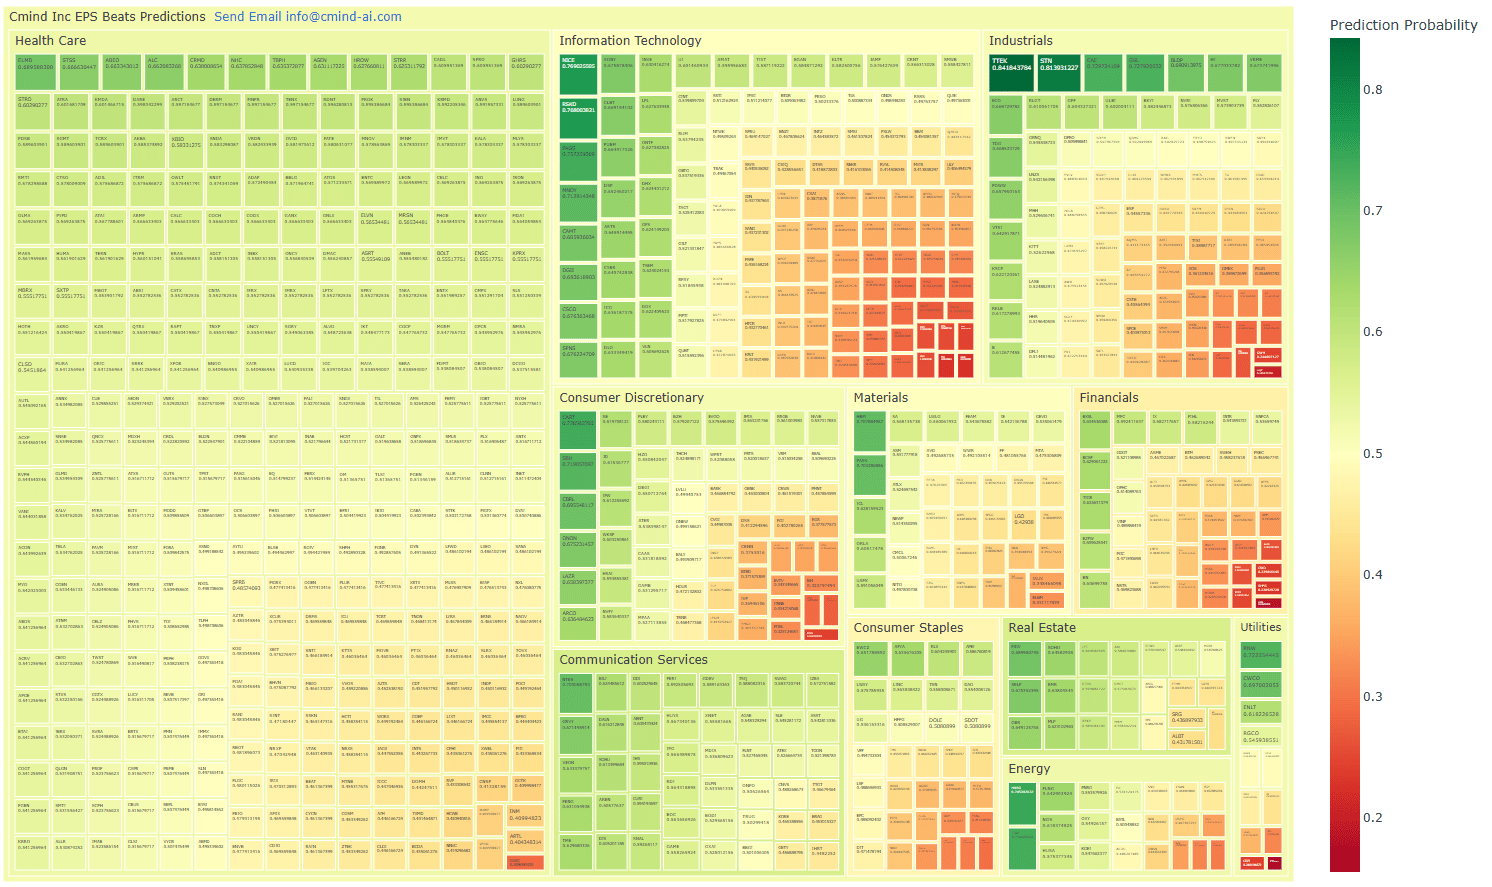
See how our model tracks the earnings beat, major commentaries and corporate events on a daily basis since its last earnings release.
The map still favors stock selection over sector beta.
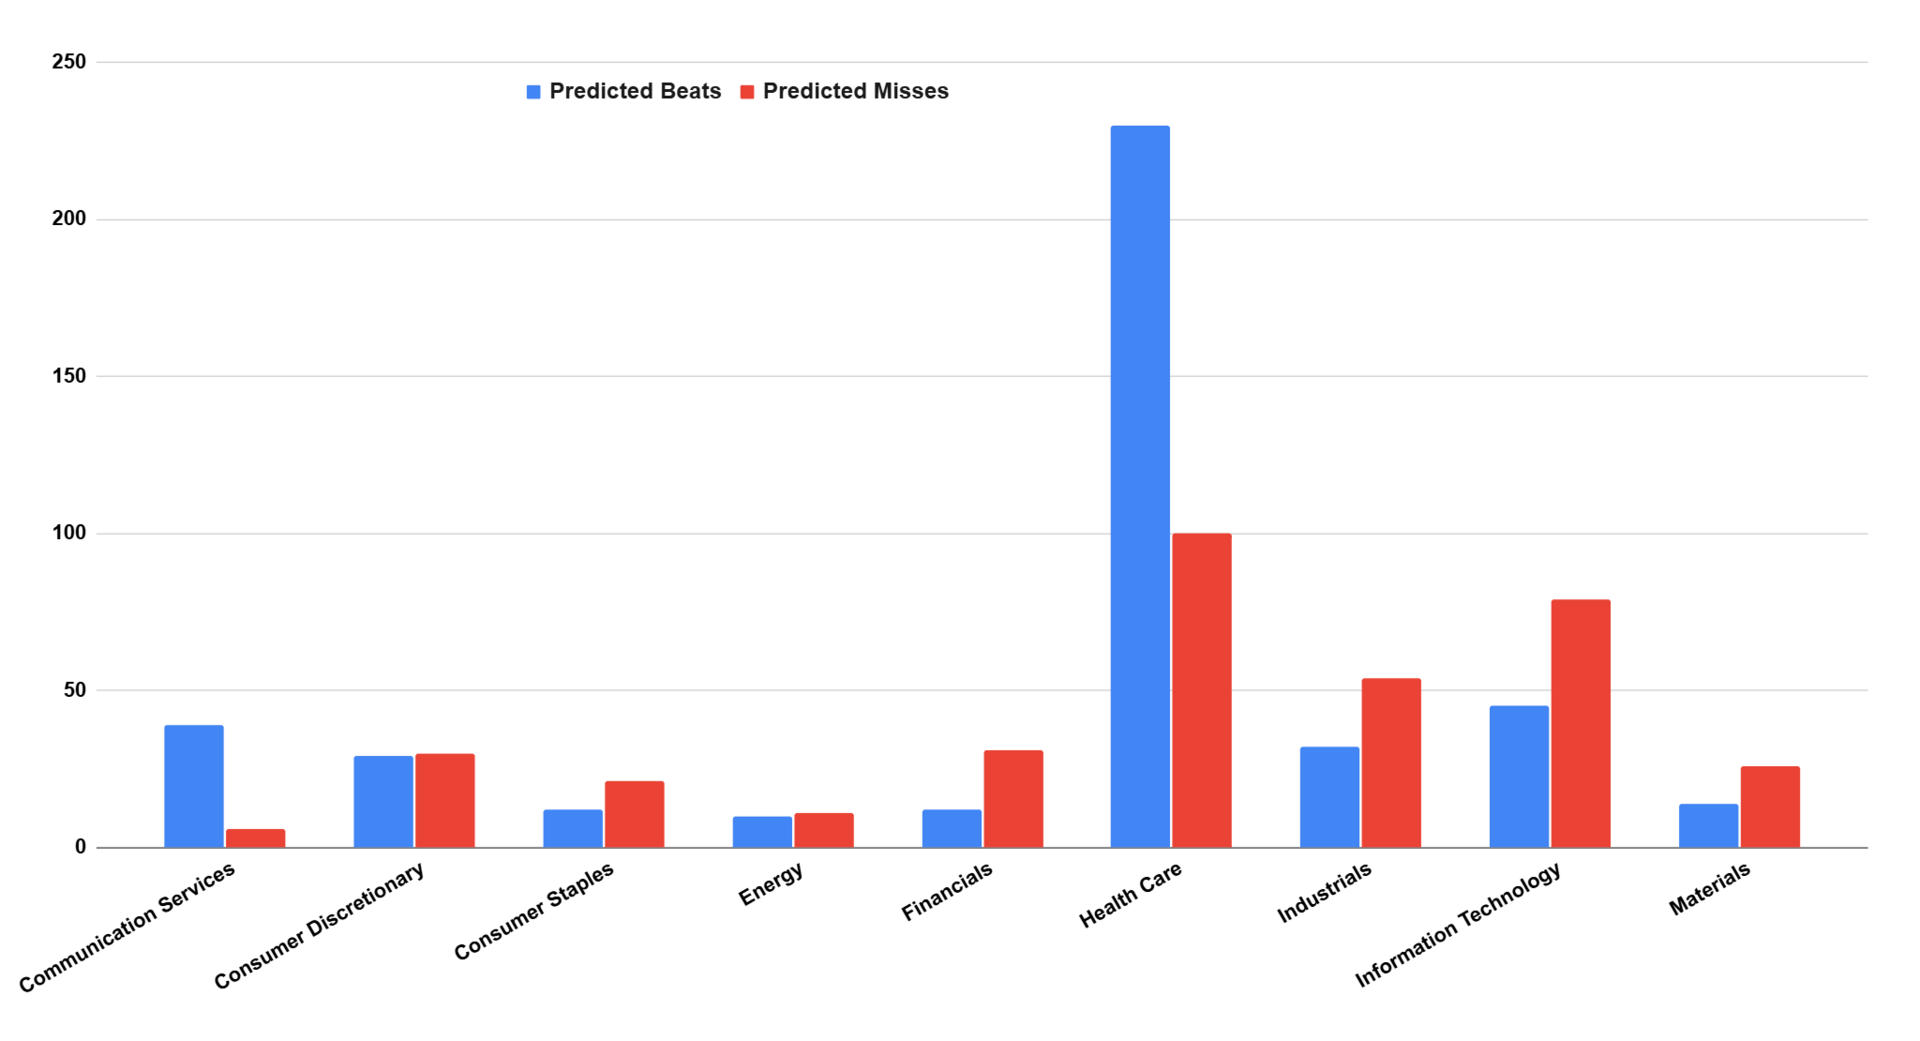
Health Care shows the broadest green—managed care, med-tech, and select large-cap bio on stable utilization and cost control—while small-cap biotech stays mixed. Communication Services tilts positive for platform names; the ad-dependent long tail remains uneven.
Technology is two-tone: AI/compute + networking lean green; peripherals/PC-tilted and long-tail software skew orange/red. Industrials are an execution barbell—backlog-rich operators and services in green, with trucking/machinery softer where volume visibility and input costs bite. Financials split as insurers/processors hold up but consumer credit/alt-fin tiles redden into the holidays.
Real Estate is mixed—datacenter/industrial and resilient resi acceptable; office still a landmine—and Utilities remain duration-sensitive with a few regulated standouts. In Consumer, Discretionary rewards brand power and inventory discipline.
This week’s heatmap still screams dispersion. The deep-green clusters are concentrated in Industrials (execution + backlog visibility), plus select Consumer Discretionary names with genuine pricing power/brand equity. Ambers/Reds cluster in rate-sensitive Real Estate, ad-dependent media, and promotion-heavy retail.
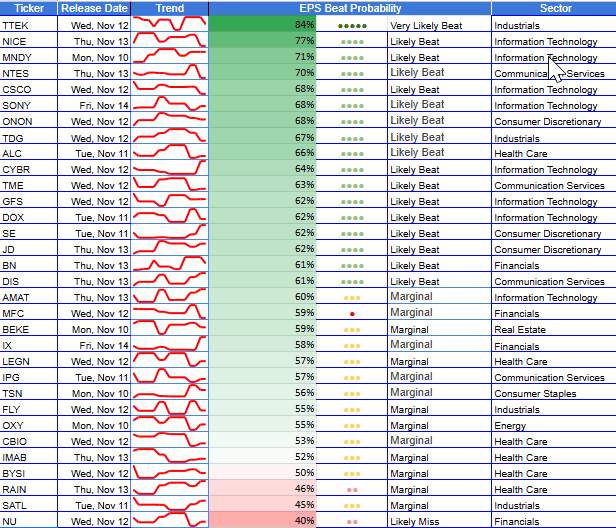
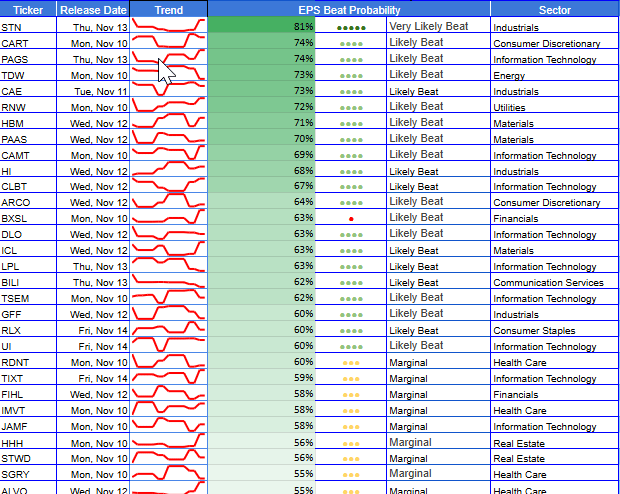
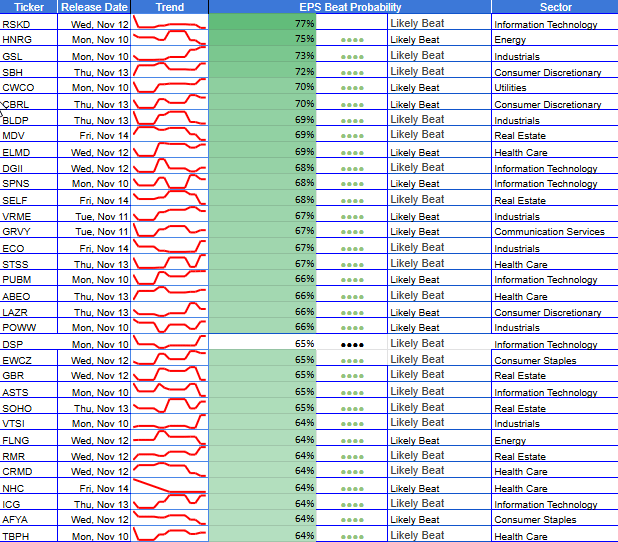
🔝 Top Predicted Beats This Week
TTEK (Nov 12) – 84% – Industrials – Large Cap
STN (Nov 13) – 81% – Industrials - Mid Cap
NICE (Nov 13) - 77% - Information Services - Large Cap
RSKD (Nov 12) – 77% – Information Services - Small Cap
HNRG (Nov 10) - 75 - Energy - Small Cap
CARI (Nov 10) - 74% - Consumer Discretionary - Mid Cap
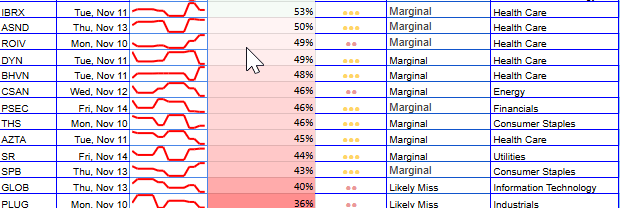
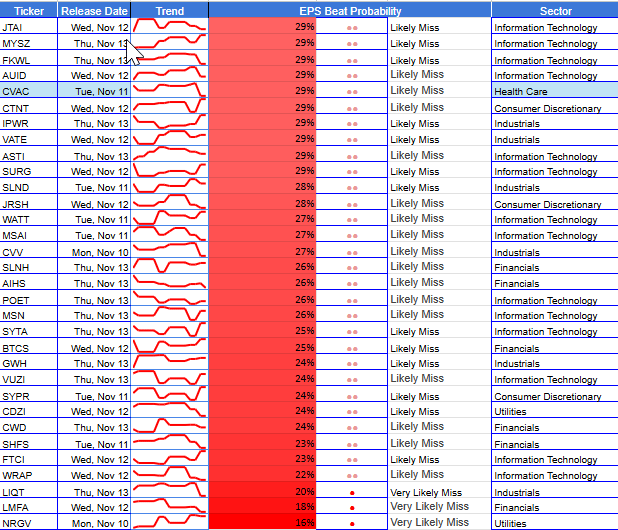
🔻Top Predicted Misses This Week
NRGV (Nov 10) – 16% – Utilities – Small Cap
LMFA (Nov 12 – 18% – Financials – Small Cap
LIQT (Nov 13) - 20% - Industrials - Small Cap
WRAP (Nov 12) – 22% – Information Services – Small Cap
FTCI (Nov 12) - 23% - Information Services - Small Cap
SHFS (Nov 11) – 23% – Financials – Small Cap
(As of November 6, 2025)
This week’s heatmap screams dispersion, not direction. You’ll find tight green belts in Health Care and parts of Communication Services, while Industrials split between backlog-rich operators (green) and volume-sensitive trucking/machinery (orange/red). Technology is unmistakably two-tone: AI/compute and networking lean green; peripherals, PC-tilted names, and smaller software skew orange/red. Materials show selective strength in specialty/industrial chemicals, softer in basic metals. Consumer Discretionary favors brand power and services over long-tail retail. Financials are a barbell—insurers/market infrastructure firm, consumer credit/alternative finance soft. Real Estate is split (data center/industrial and residential acceptable; office remains a landmine).
Click here or the following heat-map to see an interactive version of it.
Next Week & Q4 Setup
The baton passes to retail and software—guidance beats prints. In retail, watch promo intensity, inventory discipline, and wage/ship costs; margins > comps. In software, expect cautious billings but better net retention where AI monetizes; pay for visibility and pricing power, not TAM. Q4 stays dispersion-heavy: AI/compute + platforms are the right tail; promo-exposed Staples, levered REITs, consumer credit the left. If rates cool, duration pain eases; otherwise prefer data center/industrial over office. Small caps hold the most convexity—own quality executors with defined-risk.
Individual Stock Predictions
The model’s map stays dispersion-heavy, not directional: greens cluster in Health Care, platform-led Comm Services, AI/compute-adjacent Tech, and backlog-rich Industrials; oranges/reds concentrate in promo-exposed Consumer Staples, peripheral/PC-tilted Tech, parts of trucking/machinery, levered REITs, and consumer-credit pockets in Financials.
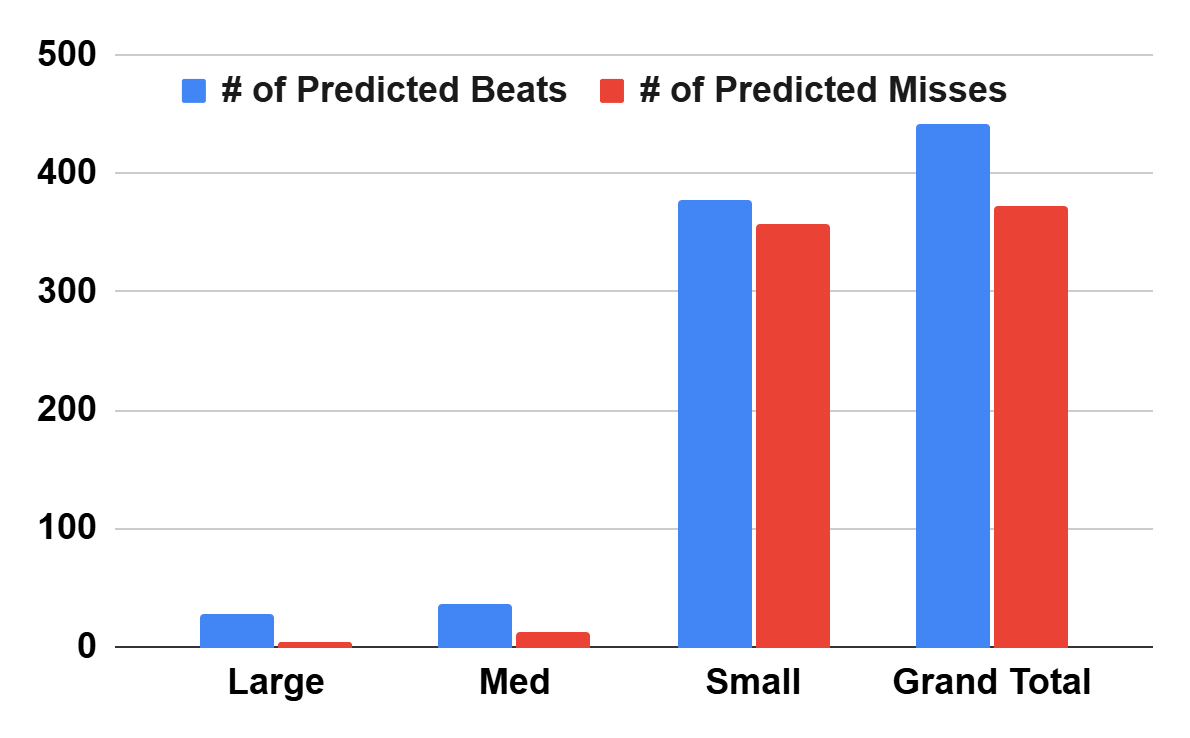
Large Caps
The right tail is anchored by execution + pricing power + visibility. In Technology, the AI/compute lane (networking, accelerators, memory/HBM supply chain) stays constructive; in Health Care, managed care/med-tech screens green on stable utilization and cost control; in Industrials, price/mix + backlog continue to separate operators from volume-chasers. The left tail remains duration-heavy REITs/Utilities, peripherals/legacy hardware, and staples facing retailer pushback.
Mid Caps
The mid-cap cohort shows the sharpest probability gradients — a playground for dispersion.
On the high side, CROX (98%), HNI (95%), ATI (96%), KBR (94%), and SPXC (92%) all sit at the top decile of the model, tied to clear execution, operating leverage, and post-call drift historically lasting multiple sessions. Tech & semis also have green standouts like CGNX (86%), CLS (81%), and LFUS (81%), reflecting firm industrial electronics demand.
Conversely, WOLF (25%), TKR (8%), and FYBR (11%) anchor the bottom tail — weak guidance, pricing power erosion, and refinancing headwinds drive their red tiles. Consumer cyclicals like CAR (22%) and CZR (24%) round out the miss-risk list, symptomatic of soft demand elasticity and higher financing costs.
Mid-caps remain best suited for pairs: long green operators such as CROX or KBR, short or hedge via weak-score names in cyclical discretionary or consumer credit. Volatility carry trades also work — the model’s high-to-low spread across mid-caps remains one of the widest in 18 months.
Small Caps
Small caps remain the volatility frontier, where signal dispersion is widest. The right tail includes RSI (96%), TILE (81%), CECO (80%), PRLB (87%), and LOCO (88%) — names combining niche leadership and efficient execution through rate volatility. Many of these operate with low correlation to index moves providing opportunities.
At the opposite extreme, SRI (10%), NCMI (13%), and FYBR (11%) headline the weakest probabilities, while KOSS (26%) and ETD (28%) round out high miss-risk consumer names. Here, liquidity and gap risk dominate.
Where conviction is high, niche industrials (HURN, VSEC) and regional financials (CPF, FMBH) continue to display clean post-earnings drift in line with model signal strength. Size small and respect volatility — alpha here comes with convexity - not comfort.
Next week hands off to retail and software—guidance > prints. In retail - (WMT / TGT / HD), prioritize margins: promo intensity, inventory, wage/ship; comps are secondary. In software (CRM / NOW / ADBE), pay for visibility & pricing power—clean net retention and AI monetization, not TAM.
About the Model
Cmind AI’s EPS predictions are powered by a machine learning model built for accuracy, objectivity, and transparency. We ingest over 150 variables across six data modalities—including real-time 10-Q filings, earnings transcripts, governance metrics, and peer signals—to provide early, company-specific EPS forecasts.
Updated daily, our model covers 4,400+ public companies, with proven backtests demonstrating Sharpe and Sortino ratio improvements across portfolios.
📩 To learn more, contact us at [email protected]